Compare trials across every parameter and target
See how each completed trial moves through its parameters and targets in a single parallel coordinates chart.
What's included
Parallel coordinates
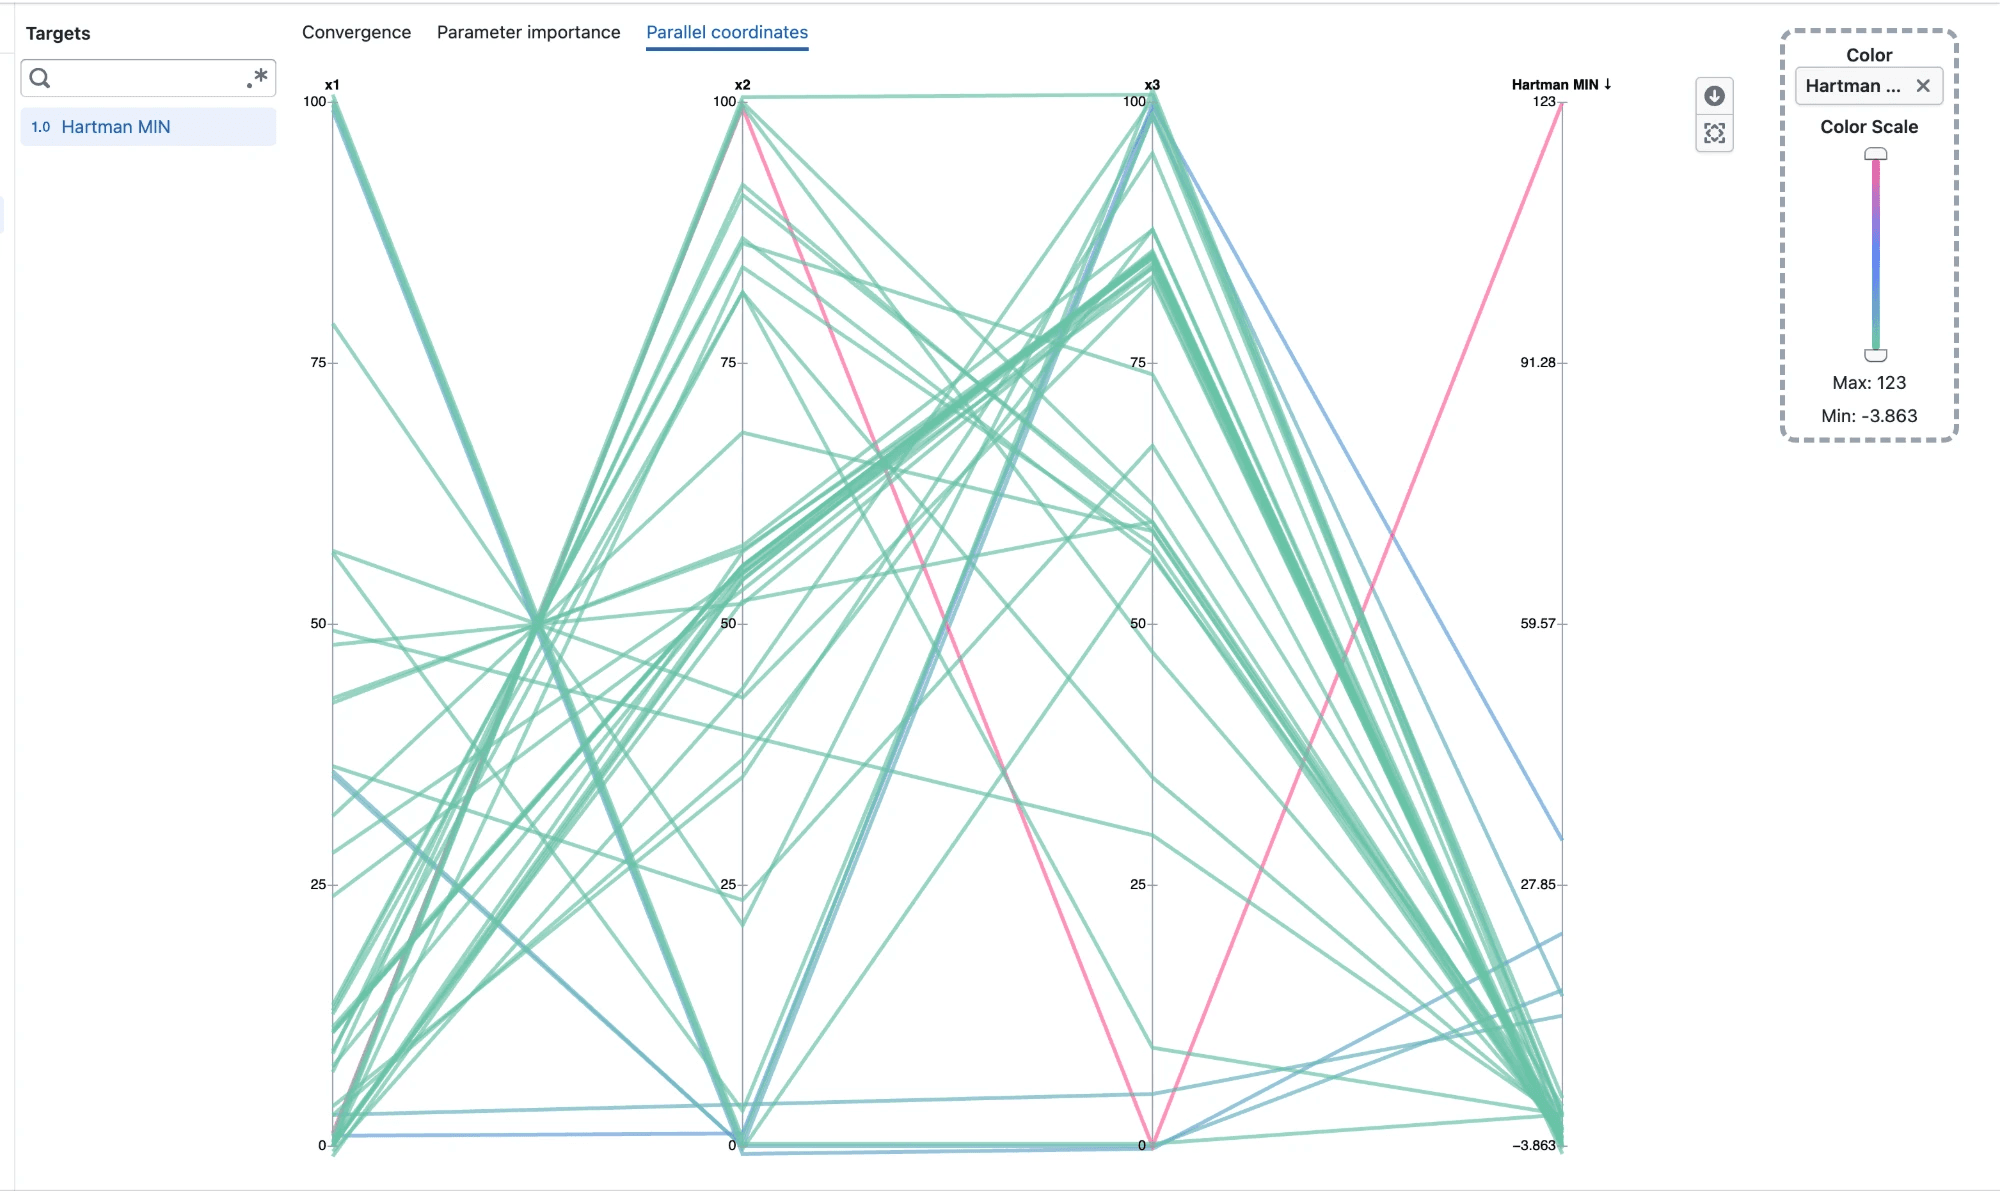
- Open Parallel coordinates from an experiment's Visualization page
- Each completed trial is drawn as one line, running across every parameter on the left and the selected targets on the right
- Every axis has its own scale, so parameters and targets with different units can be compared side by side
- Categorical parameters show one tick per category
- Hover a line to see that trial's values on every axis
Reorder axes
- Drag an axis title left or right to move that axis
- Place related parameters next to each other, or move a parameter next to a target to see how they relate
Color by target
- Lines are colored by the last selected target, so you can follow where trials end up
- Drag any target from the sidebar onto Color to color by it instead
- A target dropped onto Color is added to the chart if it is not already selected
- Use the color scale slider to show only trials within a range of target values
- Clear Color to show every line in a single color
Overlapping trials
- Trials that share the same value on an axis are spread slightly apart, so each one stays visible
- Trials with unique values stay exactly on their tick
Notes
- Only completed trials with a value on every axis are shown
- Axis order and color choice reset when you leave the Parallel coordinates tab