Compare trials across every parameter and target

See how each completed trial moves through its parameters and targets in a single parallel coordinates chart.

What's included​

Parallel coordinates​

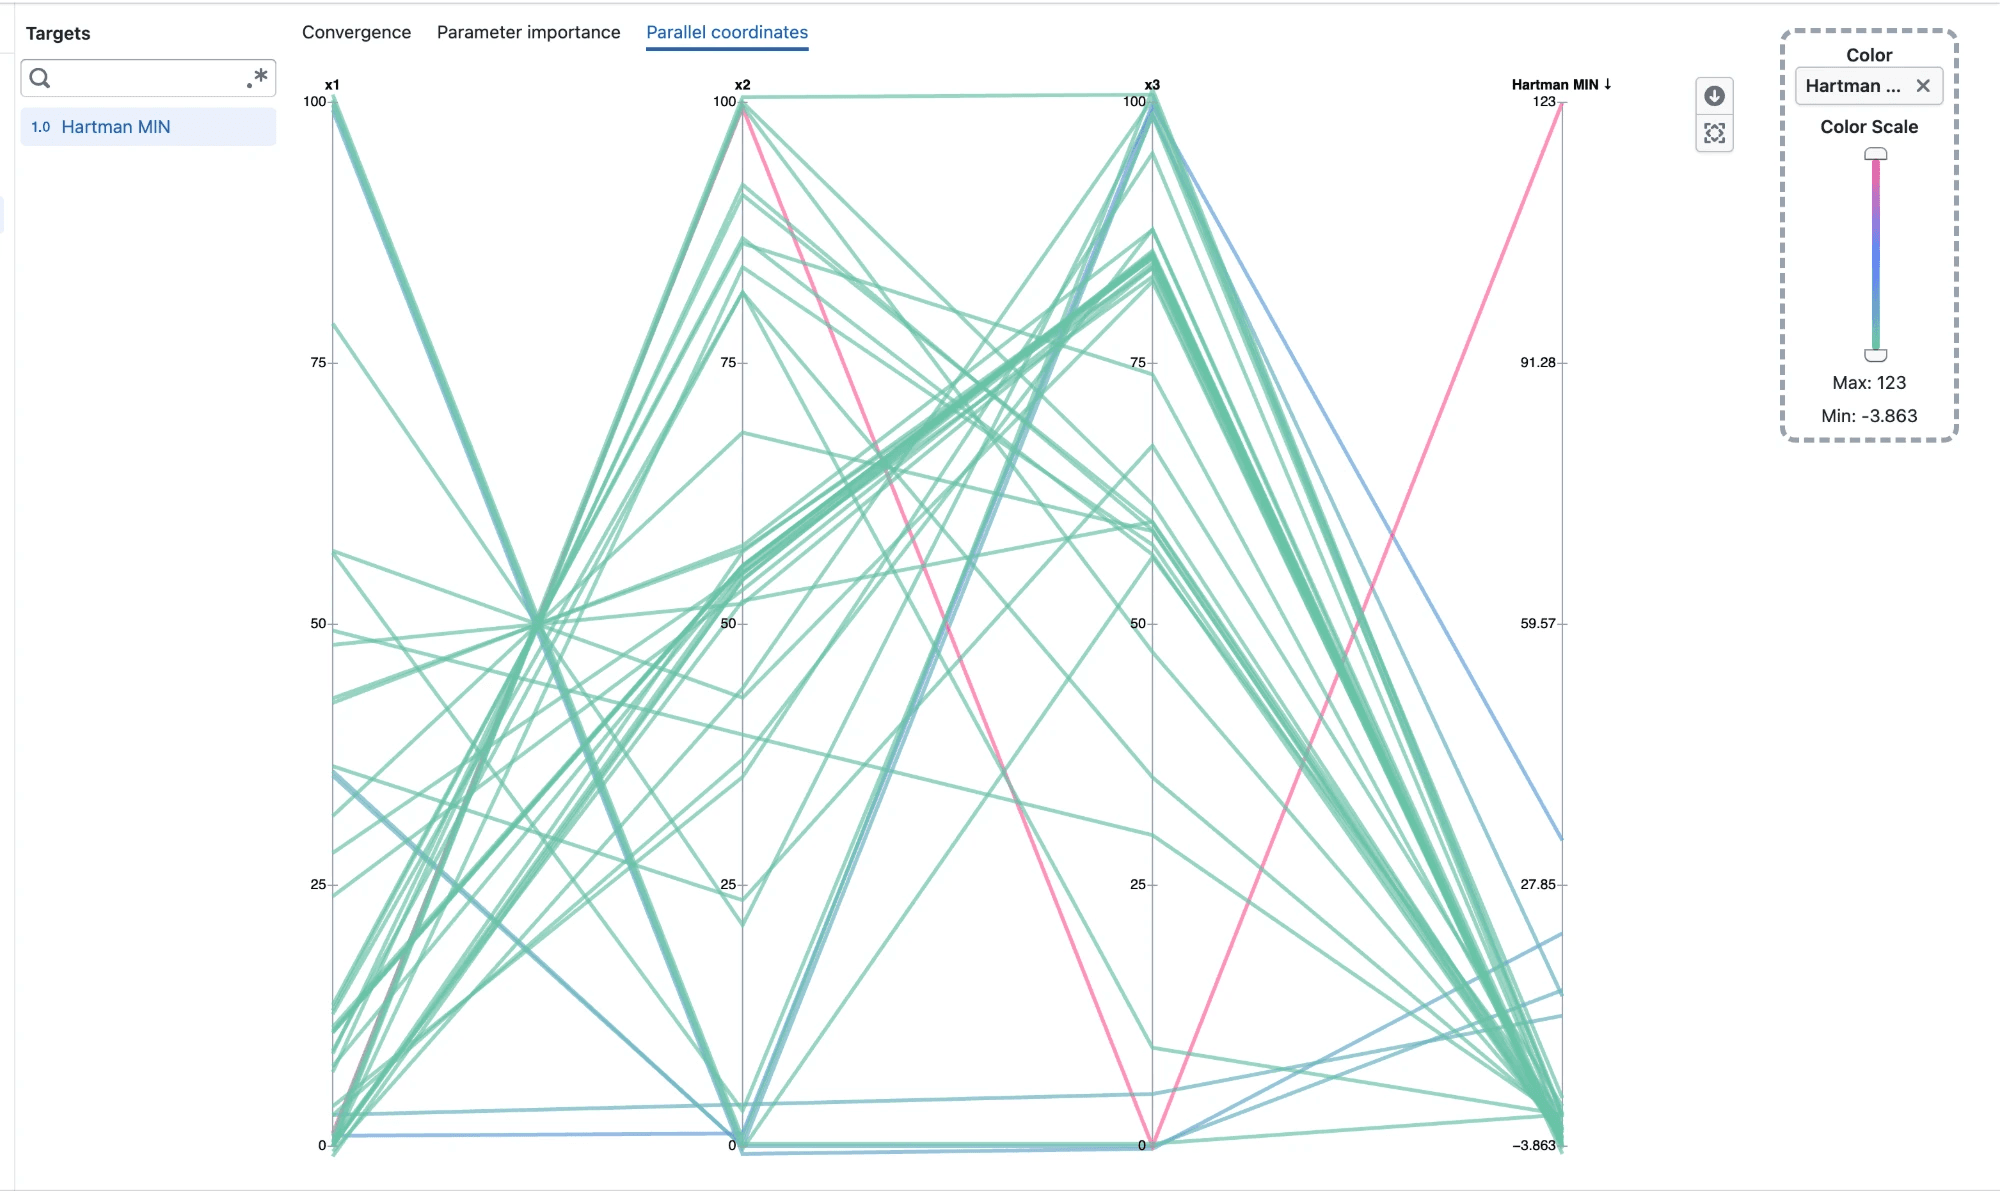
Parallel coordinates chart of Hartmann trials across x1, x2, x3 and the Hartman MIN target, colored by target value

  • Open Parallel coordinates from an experiment's Visualization page
  • Each completed trial is drawn as one line, running across every parameter on the left and the selected targets on the right
  • Every axis has its own scale, so parameters and targets with different units can be compared side by side
  • Categorical parameters show one tick per category
  • Hover a line to see that trial's values on every axis

Reorder axes​

  • Drag an axis title left or right to move that axis
  • Place related parameters next to each other, or move a parameter next to a target to see how they relate

Color by target​

  • Lines are colored by the last selected target, so you can follow where trials end up
  • Drag any target from the sidebar onto Color to color by it instead
  • A target dropped onto Color is added to the chart if it is not already selected
  • Use the color scale slider to show only trials within a range of target values
  • Clear Color to show every line in a single color

Overlapping trials​

  • Trials that share the same value on an axis are spread slightly apart, so each one stays visible
  • Trials with unique values stay exactly on their tick

Notes​

  • Only completed trials with a value on every axis are shown
  • Axis order and color choice reset when you leave the Parallel coordinates tab
Linear constraints for discrete parameters

Weight each discrete parameter with its own coefficient, and see a preview of the rule as you build it.

What's included​

Linear replaces Sum​

  • The Sum constraint for discrete numerical parameters is now called Linear
  • Give each parameter a coefficient, for example 2 × x0 + x1 <= 100
  • Coefficients start at 1, which gives a plain sum
  • Use a negative coefficient to compare two parameters

Preview of your rule​

  • A preview below the form shows the rule as you fill it in, for example 2 · x0 + x1 <= 100

Example: keep x1 at or below x0​

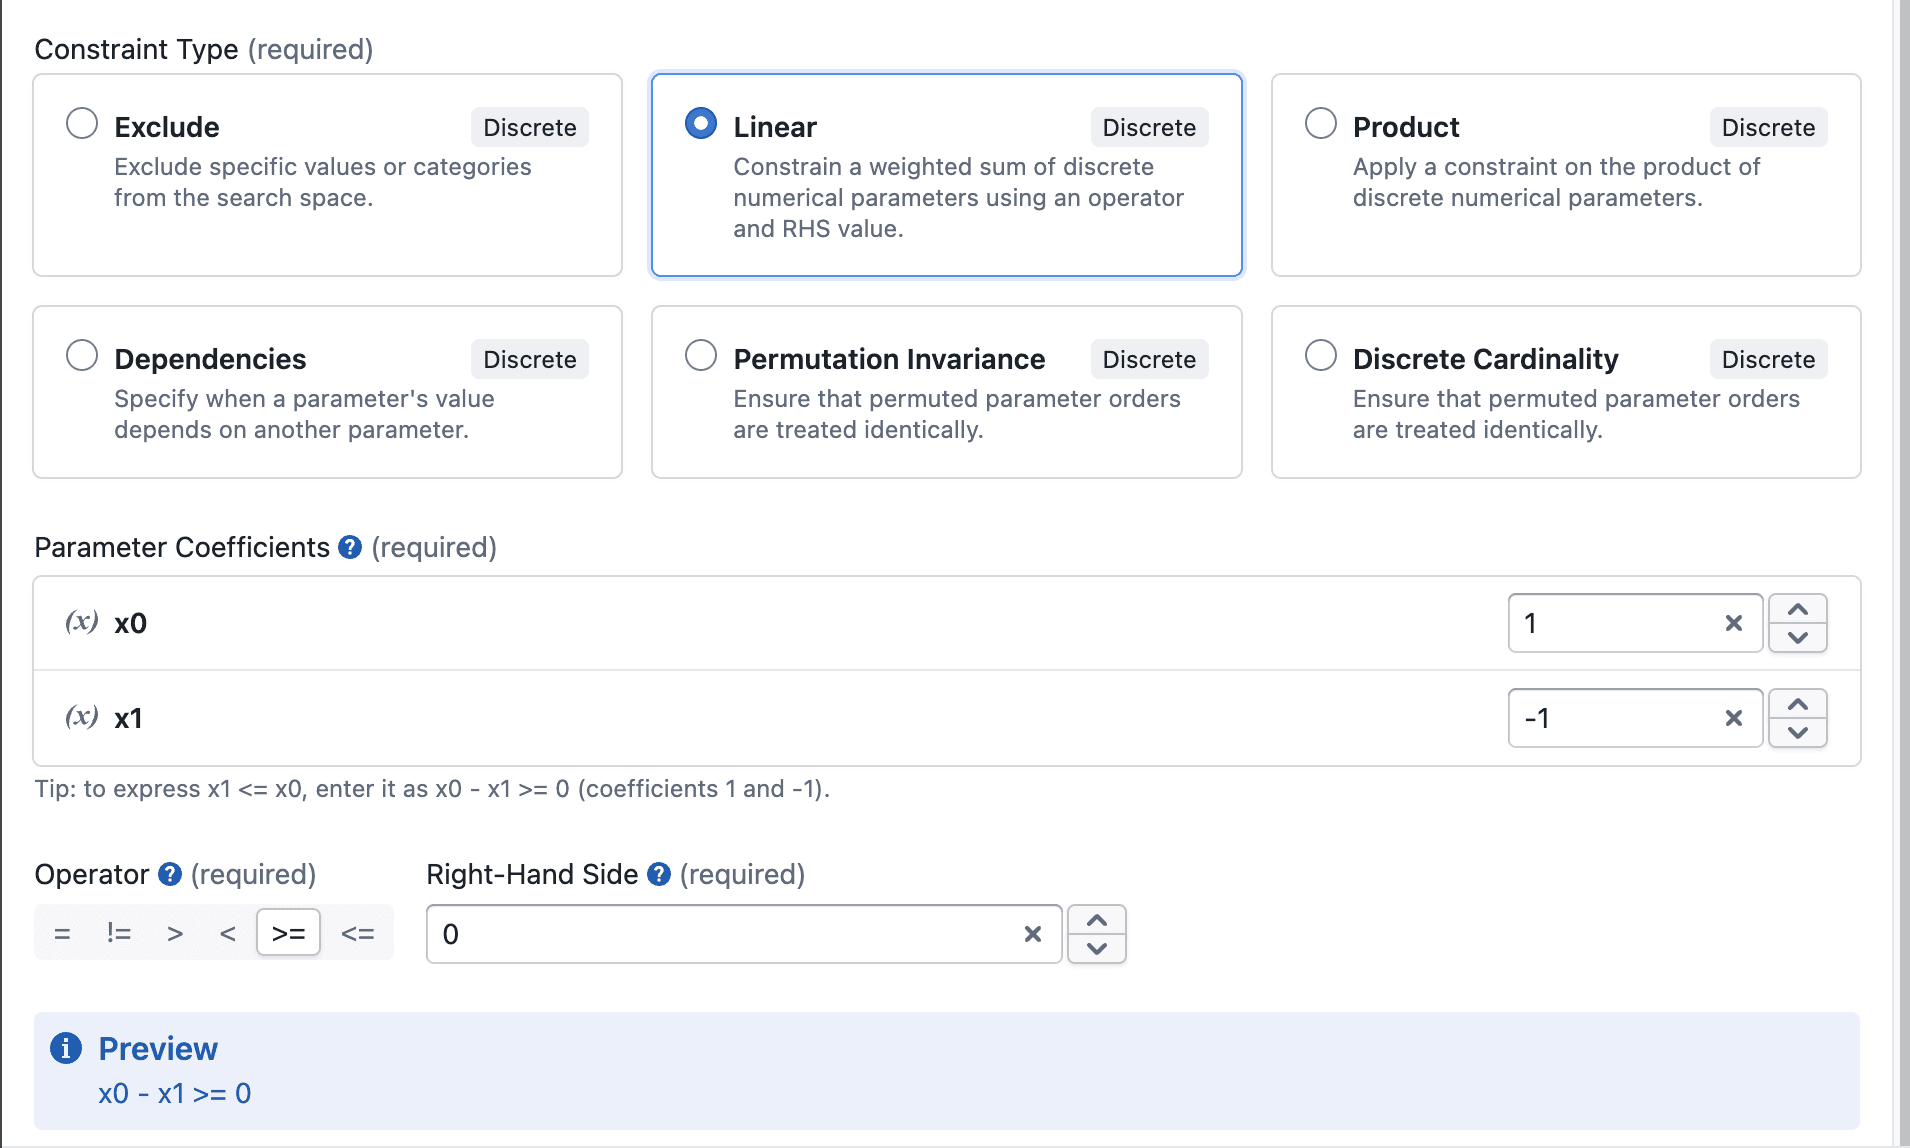
Linear constraint with coefficients 1 and -1, operator &gt;= and right-hand side 0, previewed as x0 - x1 &gt;= 0

To make sure x1 ≤ x0, write it as x0 − x1 ≥ 0 and add a Linear constraint:

  • Coefficients: x0 = 1, x1 = −1
  • Operator: >=
  • Right-Hand Side: 0

Other improvements​

  • Negative numbers and decimals can be typed directly in Linear and Product constraints
  • Removing a parameter from the Selected list now also removes its coefficient or condition

Notes​

  • Your existing Sum constraints are now Linear constraints with every coefficient set to 1, so they work exactly as before
  • Tolerance only applies to the = and != operators

Convergence plots organized by observation order

Follow optimization progress more clearly with completed results ordered as observations and predictions grouped separately.

What's included​

A clearer optimization sequence​

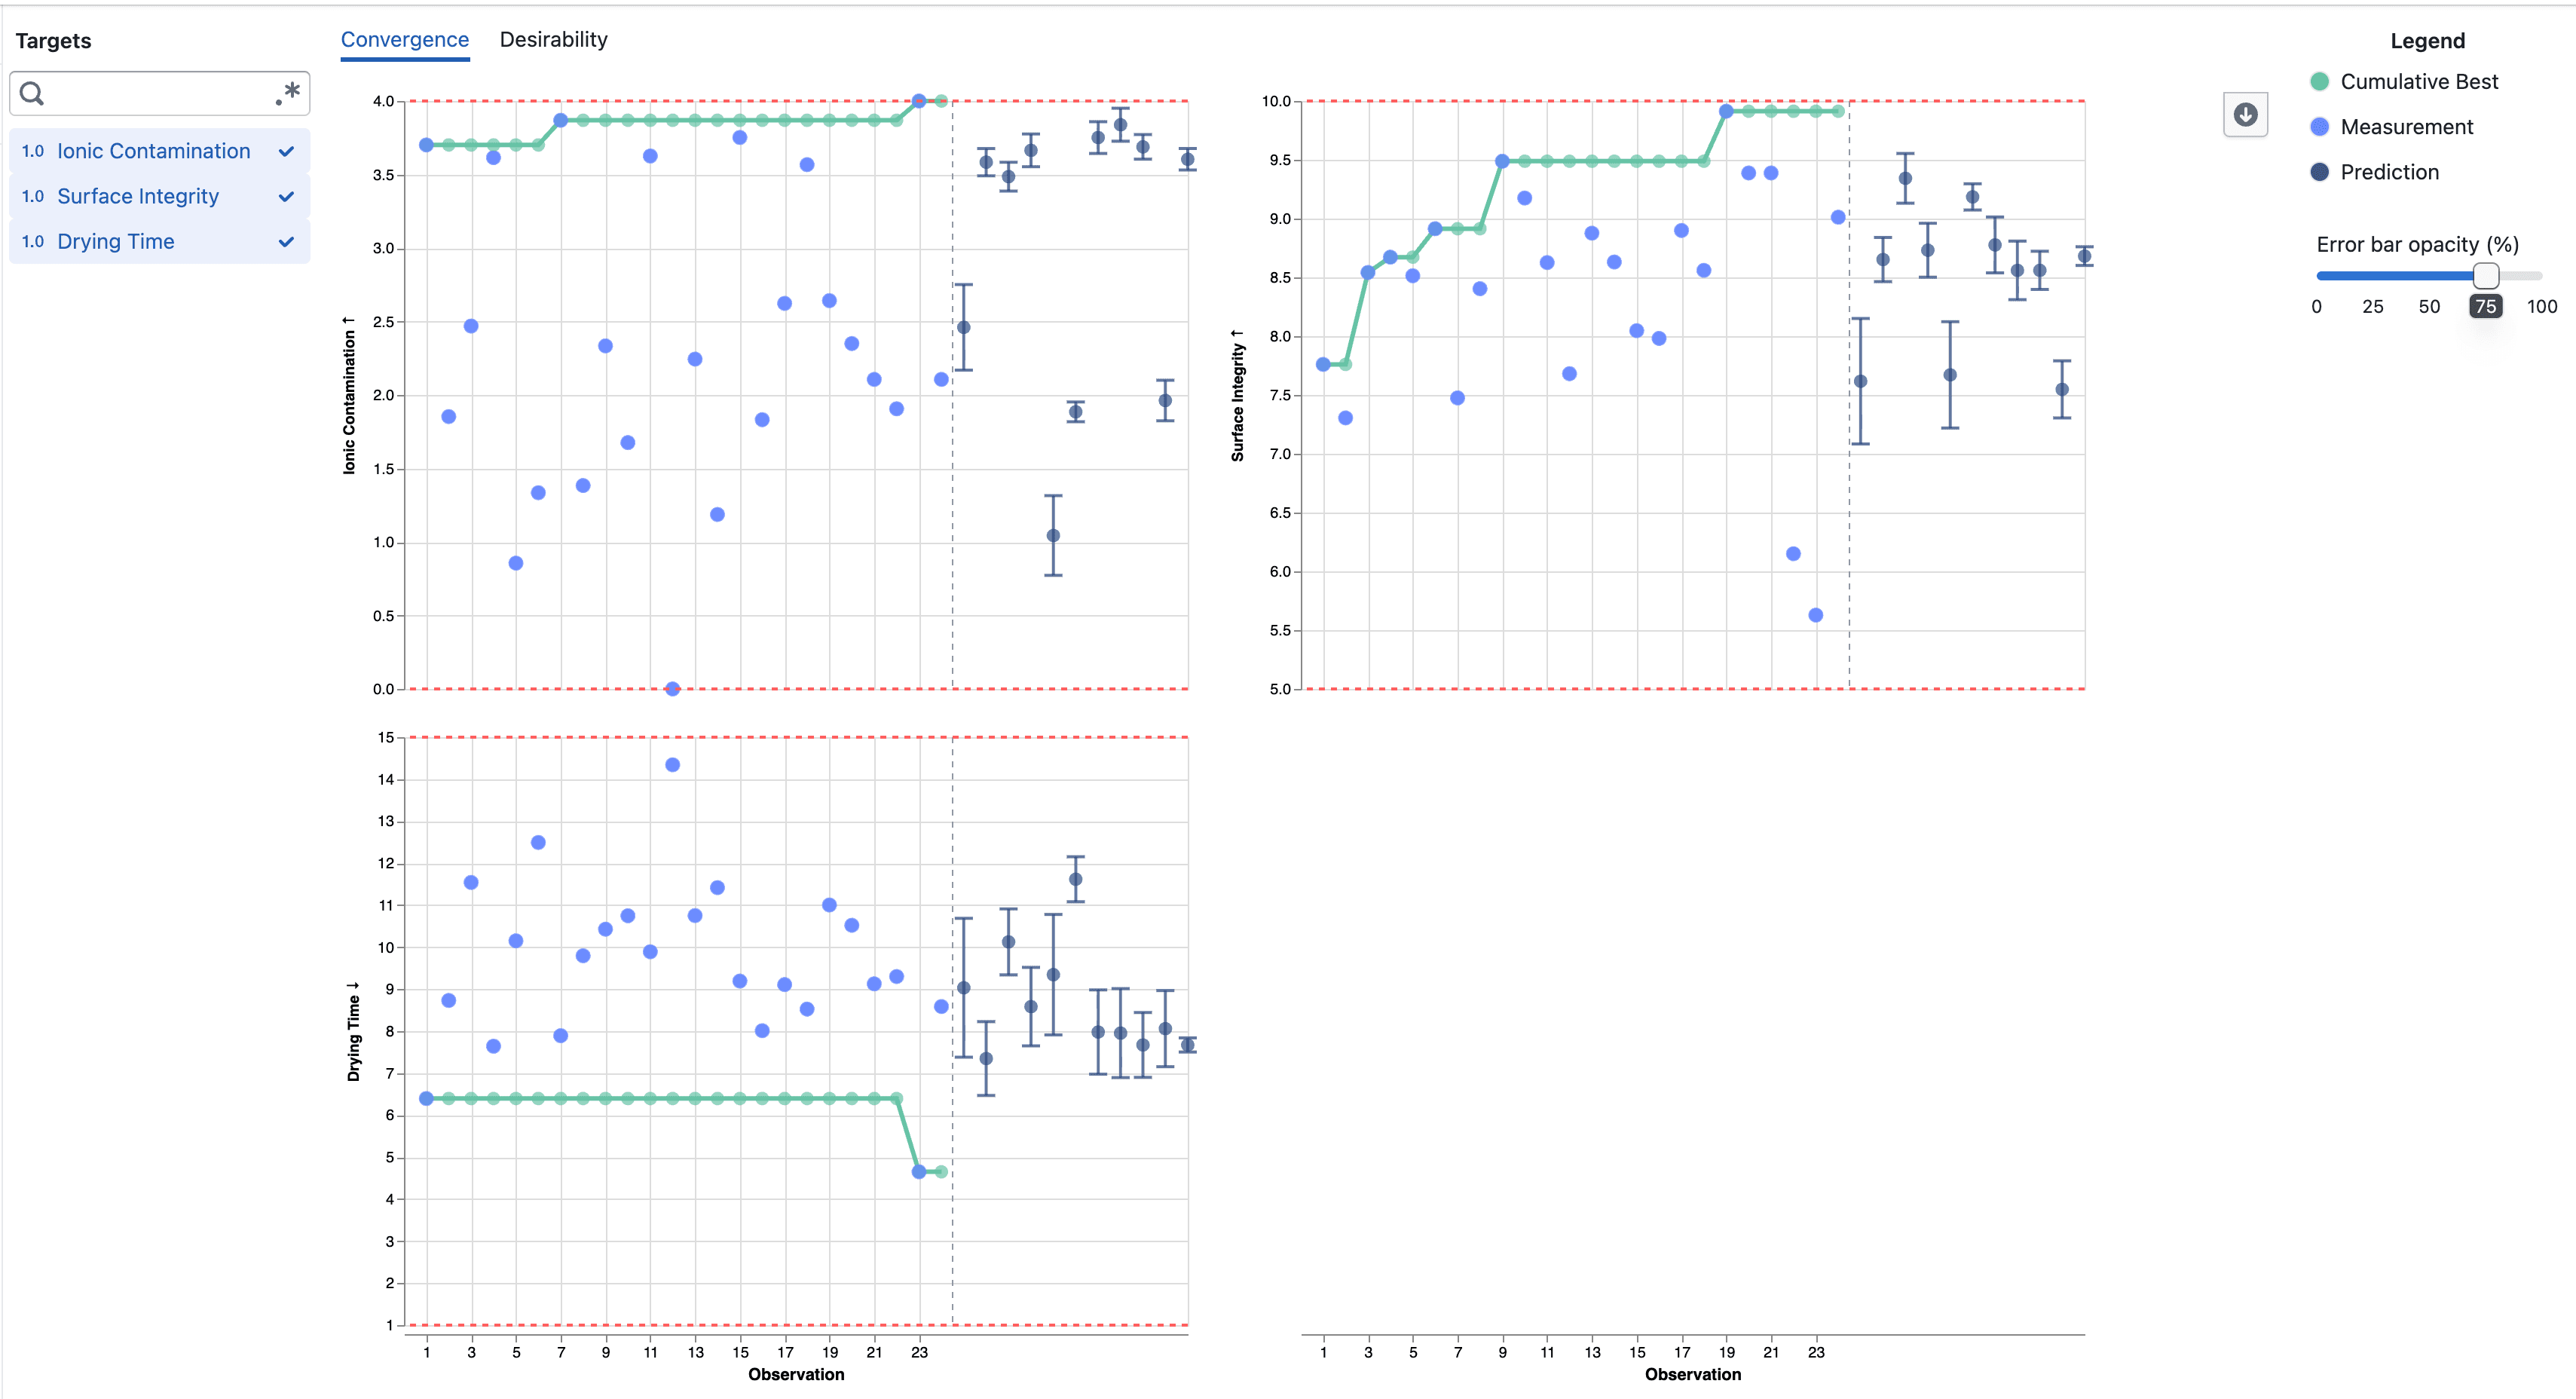
Convergence plots showing completed observations followed by predictions

  • Completed target results are numbered in completion order, without gaps from trials that did not produce a measurement
  • The original trial number and completion time remain available in the point details
  • Predictions for Pending and Accepted trials appear after the completed observations
  • A dashed divider separates measured results from predictions across selected targets

Notes​

  • The observation number can differ from the original trial number when trials finish out of order or do not produce a target result
  • Predictions remain model estimates and include error bars showing one posterior standard deviation above and below the mean

Understand what drives experiment predictions

Explore how each parameter influences experiment targets with SHAP-based importance visualizations.

What's included​

Parameter importance​

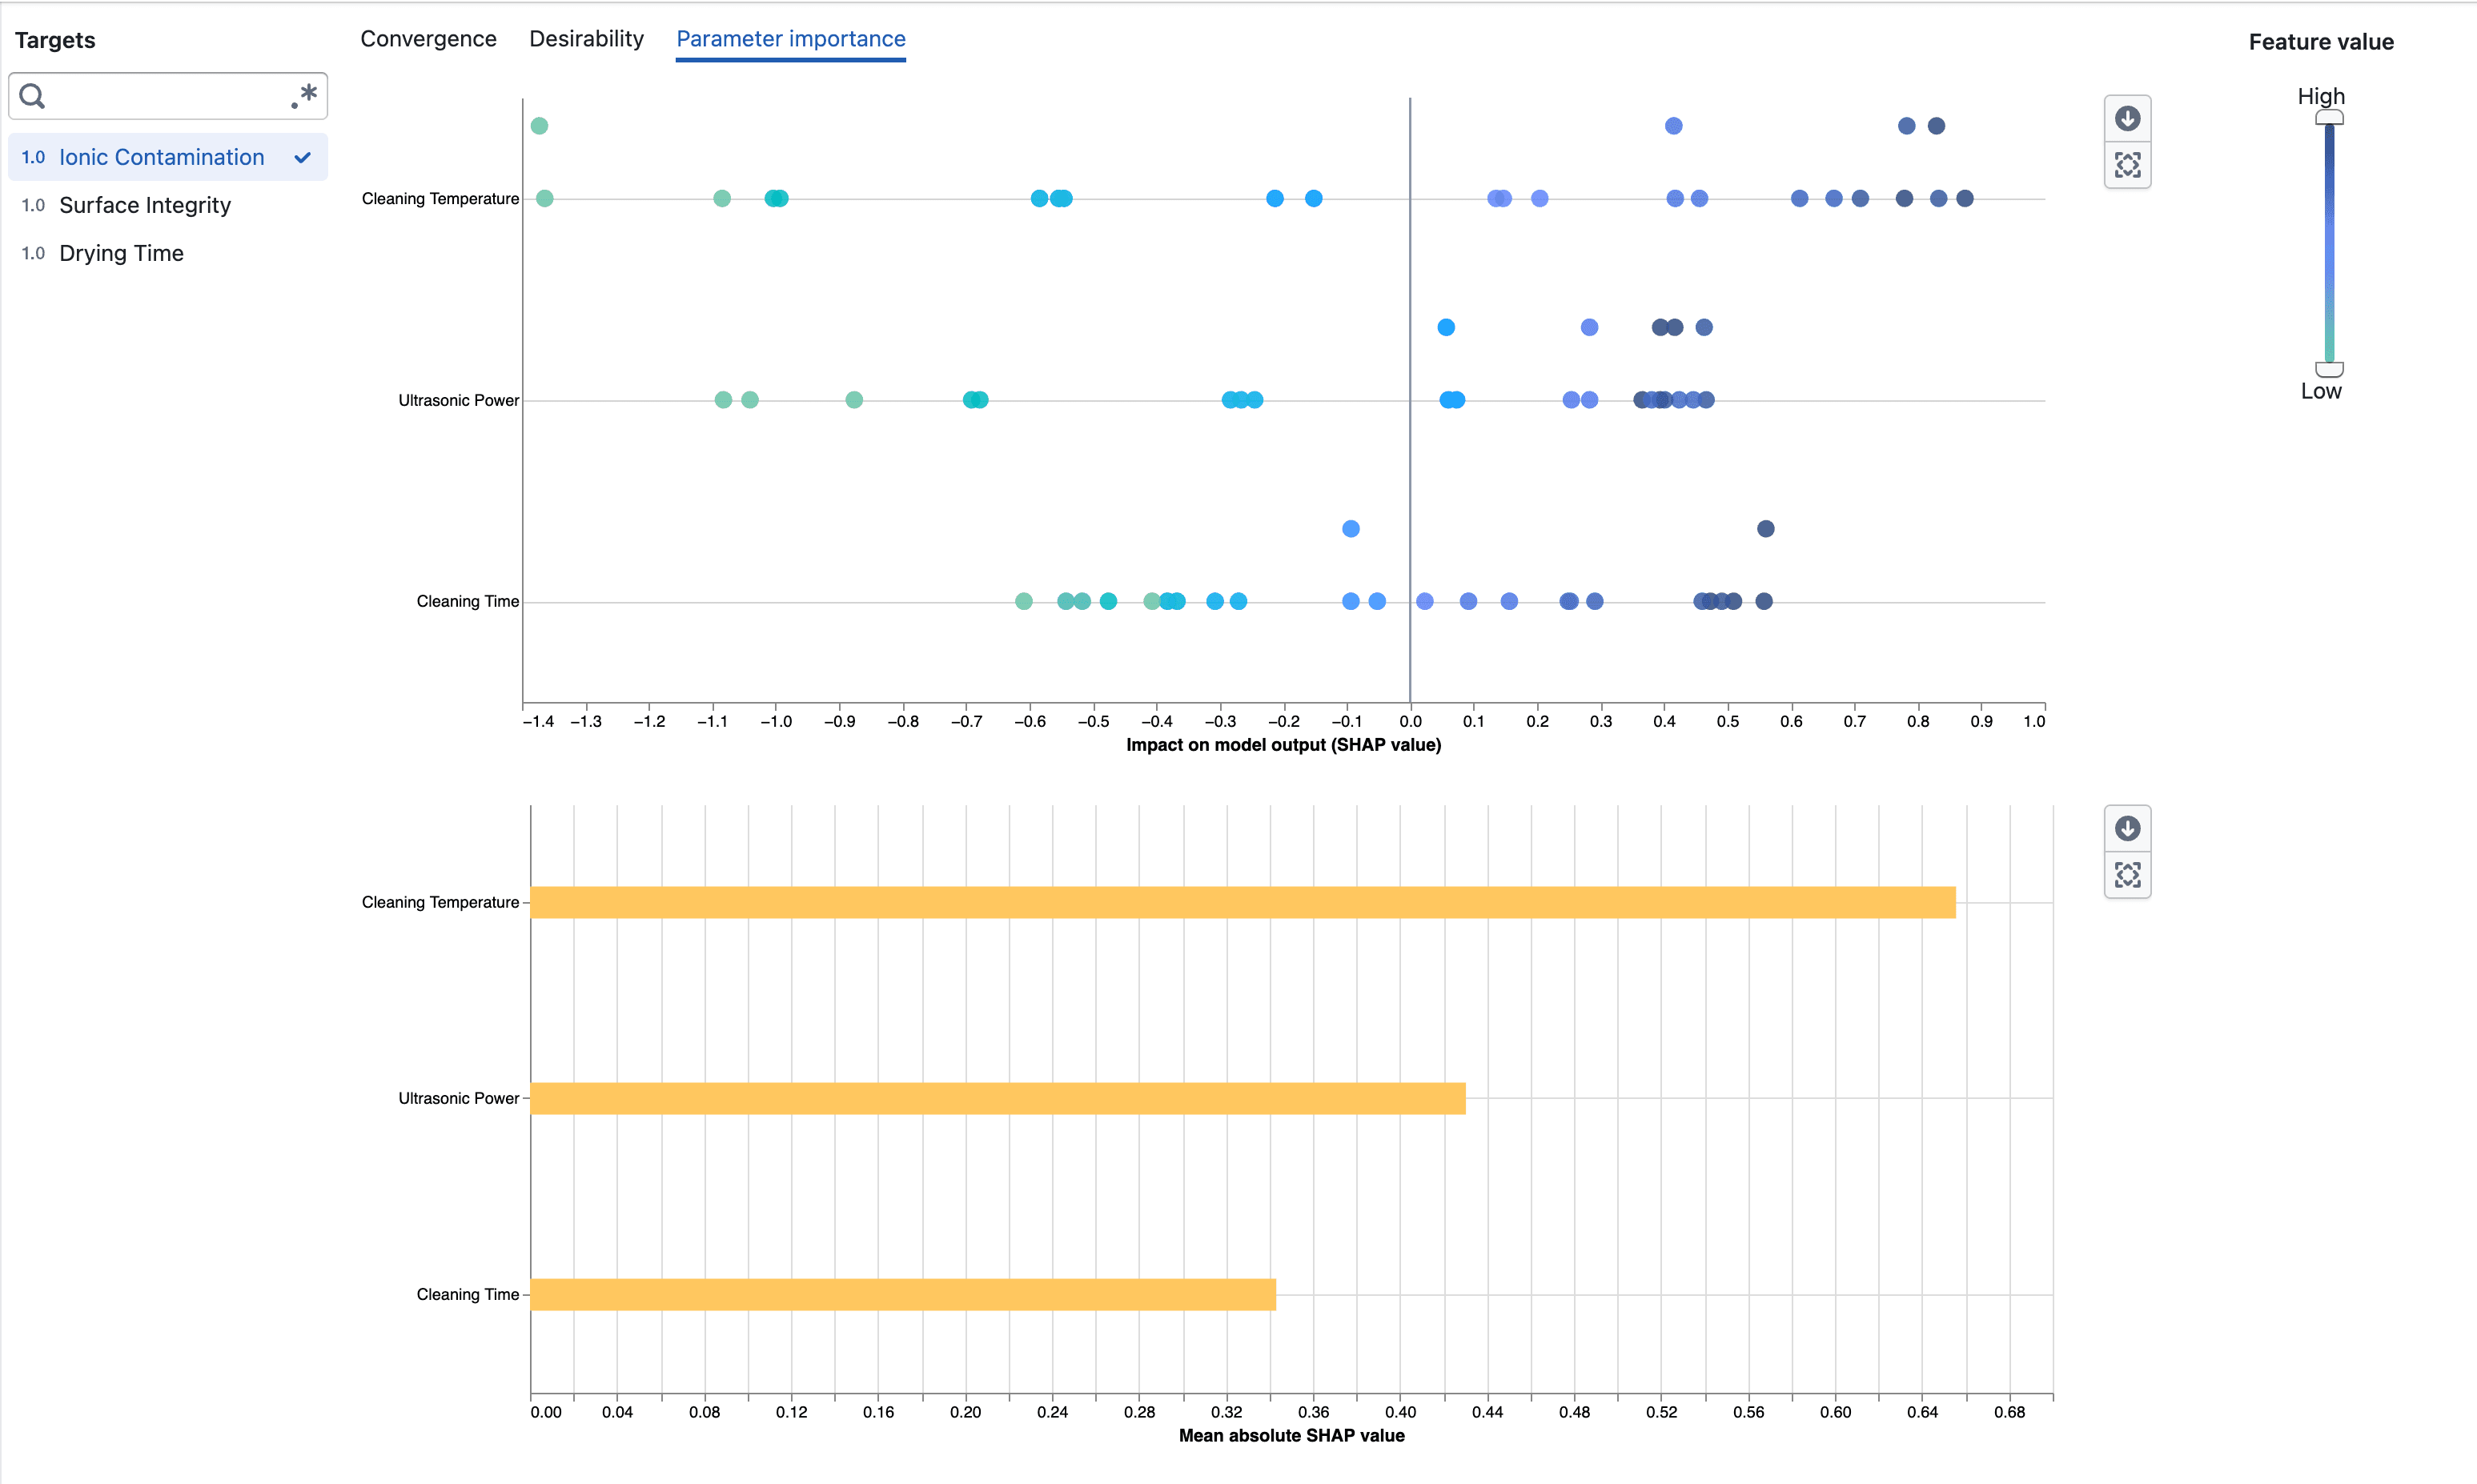
Parameter importance beeswarm and mean absolute SHAP charts

  • Open Parameter importance from an experiment's Visualization page
  • Select a target to inspect how its parameters contribute to the surrogate model output
  • Compare parameters using their mean absolute SHAP values
  • See the direction and distribution of each parameter's impact in the beeswarm plot
  • Use the feature-value scale to focus on observations with low or high numeric parameter values

Notes​

  • Parameter importance requires enough completed measurements to fit the surrogate model
  • SHAP values describe model behavior and do not imply that a parameter causes a target outcome

Target predictions for open experiment trials

View BayBE target predictions and their uncertainty for Pending and Accepted trials.

What's included​

Predictions in trial cards​

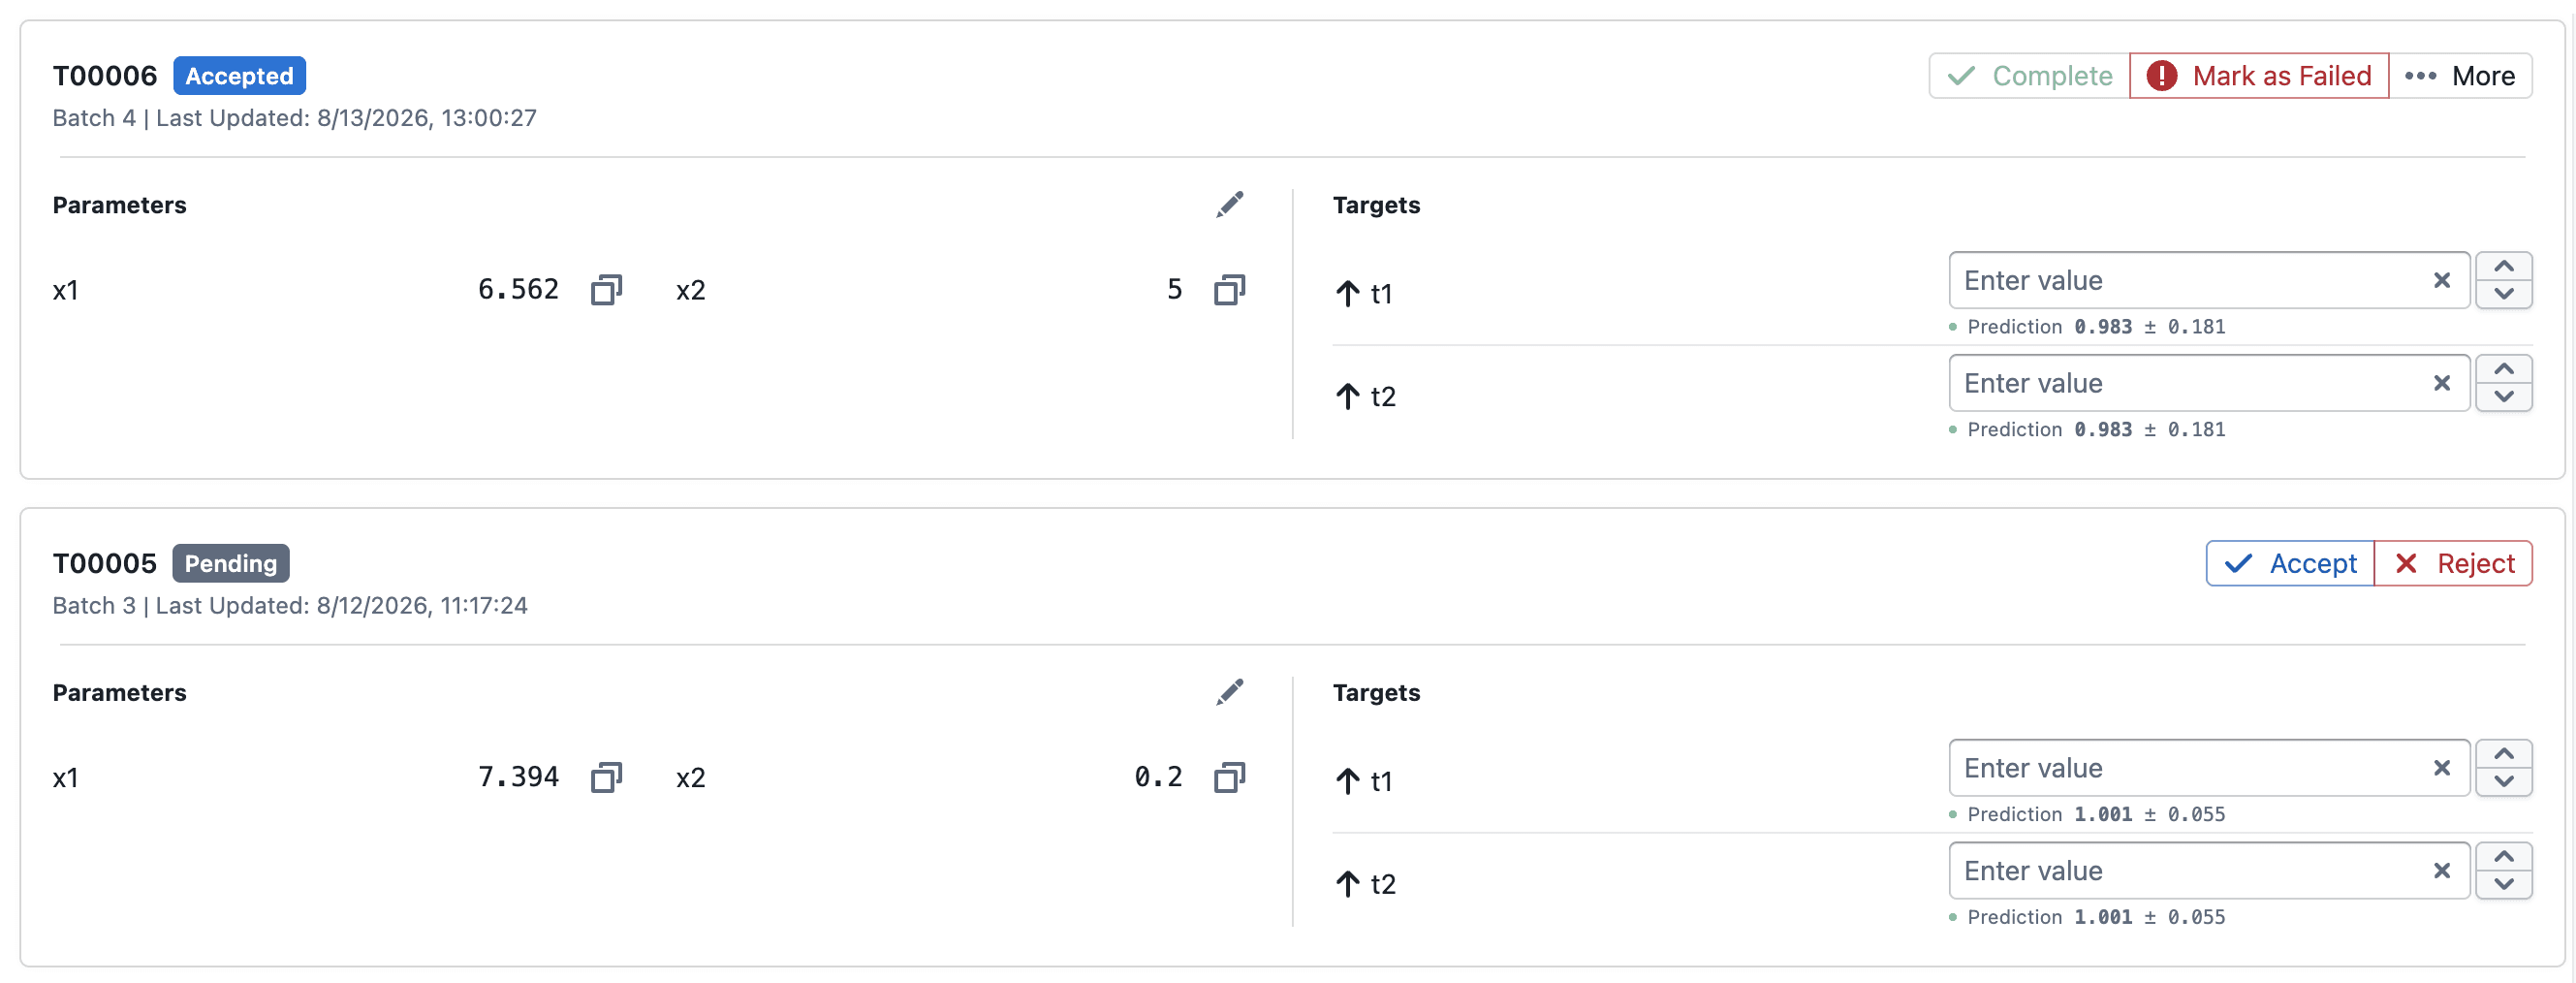
Predictions displayed for Pending and Accepted trial targets

  • Pending and Accepted trial cards show each target's predicted mean and posterior standard deviation as mean ± std
  • Predictions update as completed trial results are added to the experiment

Predictions in Convergence​

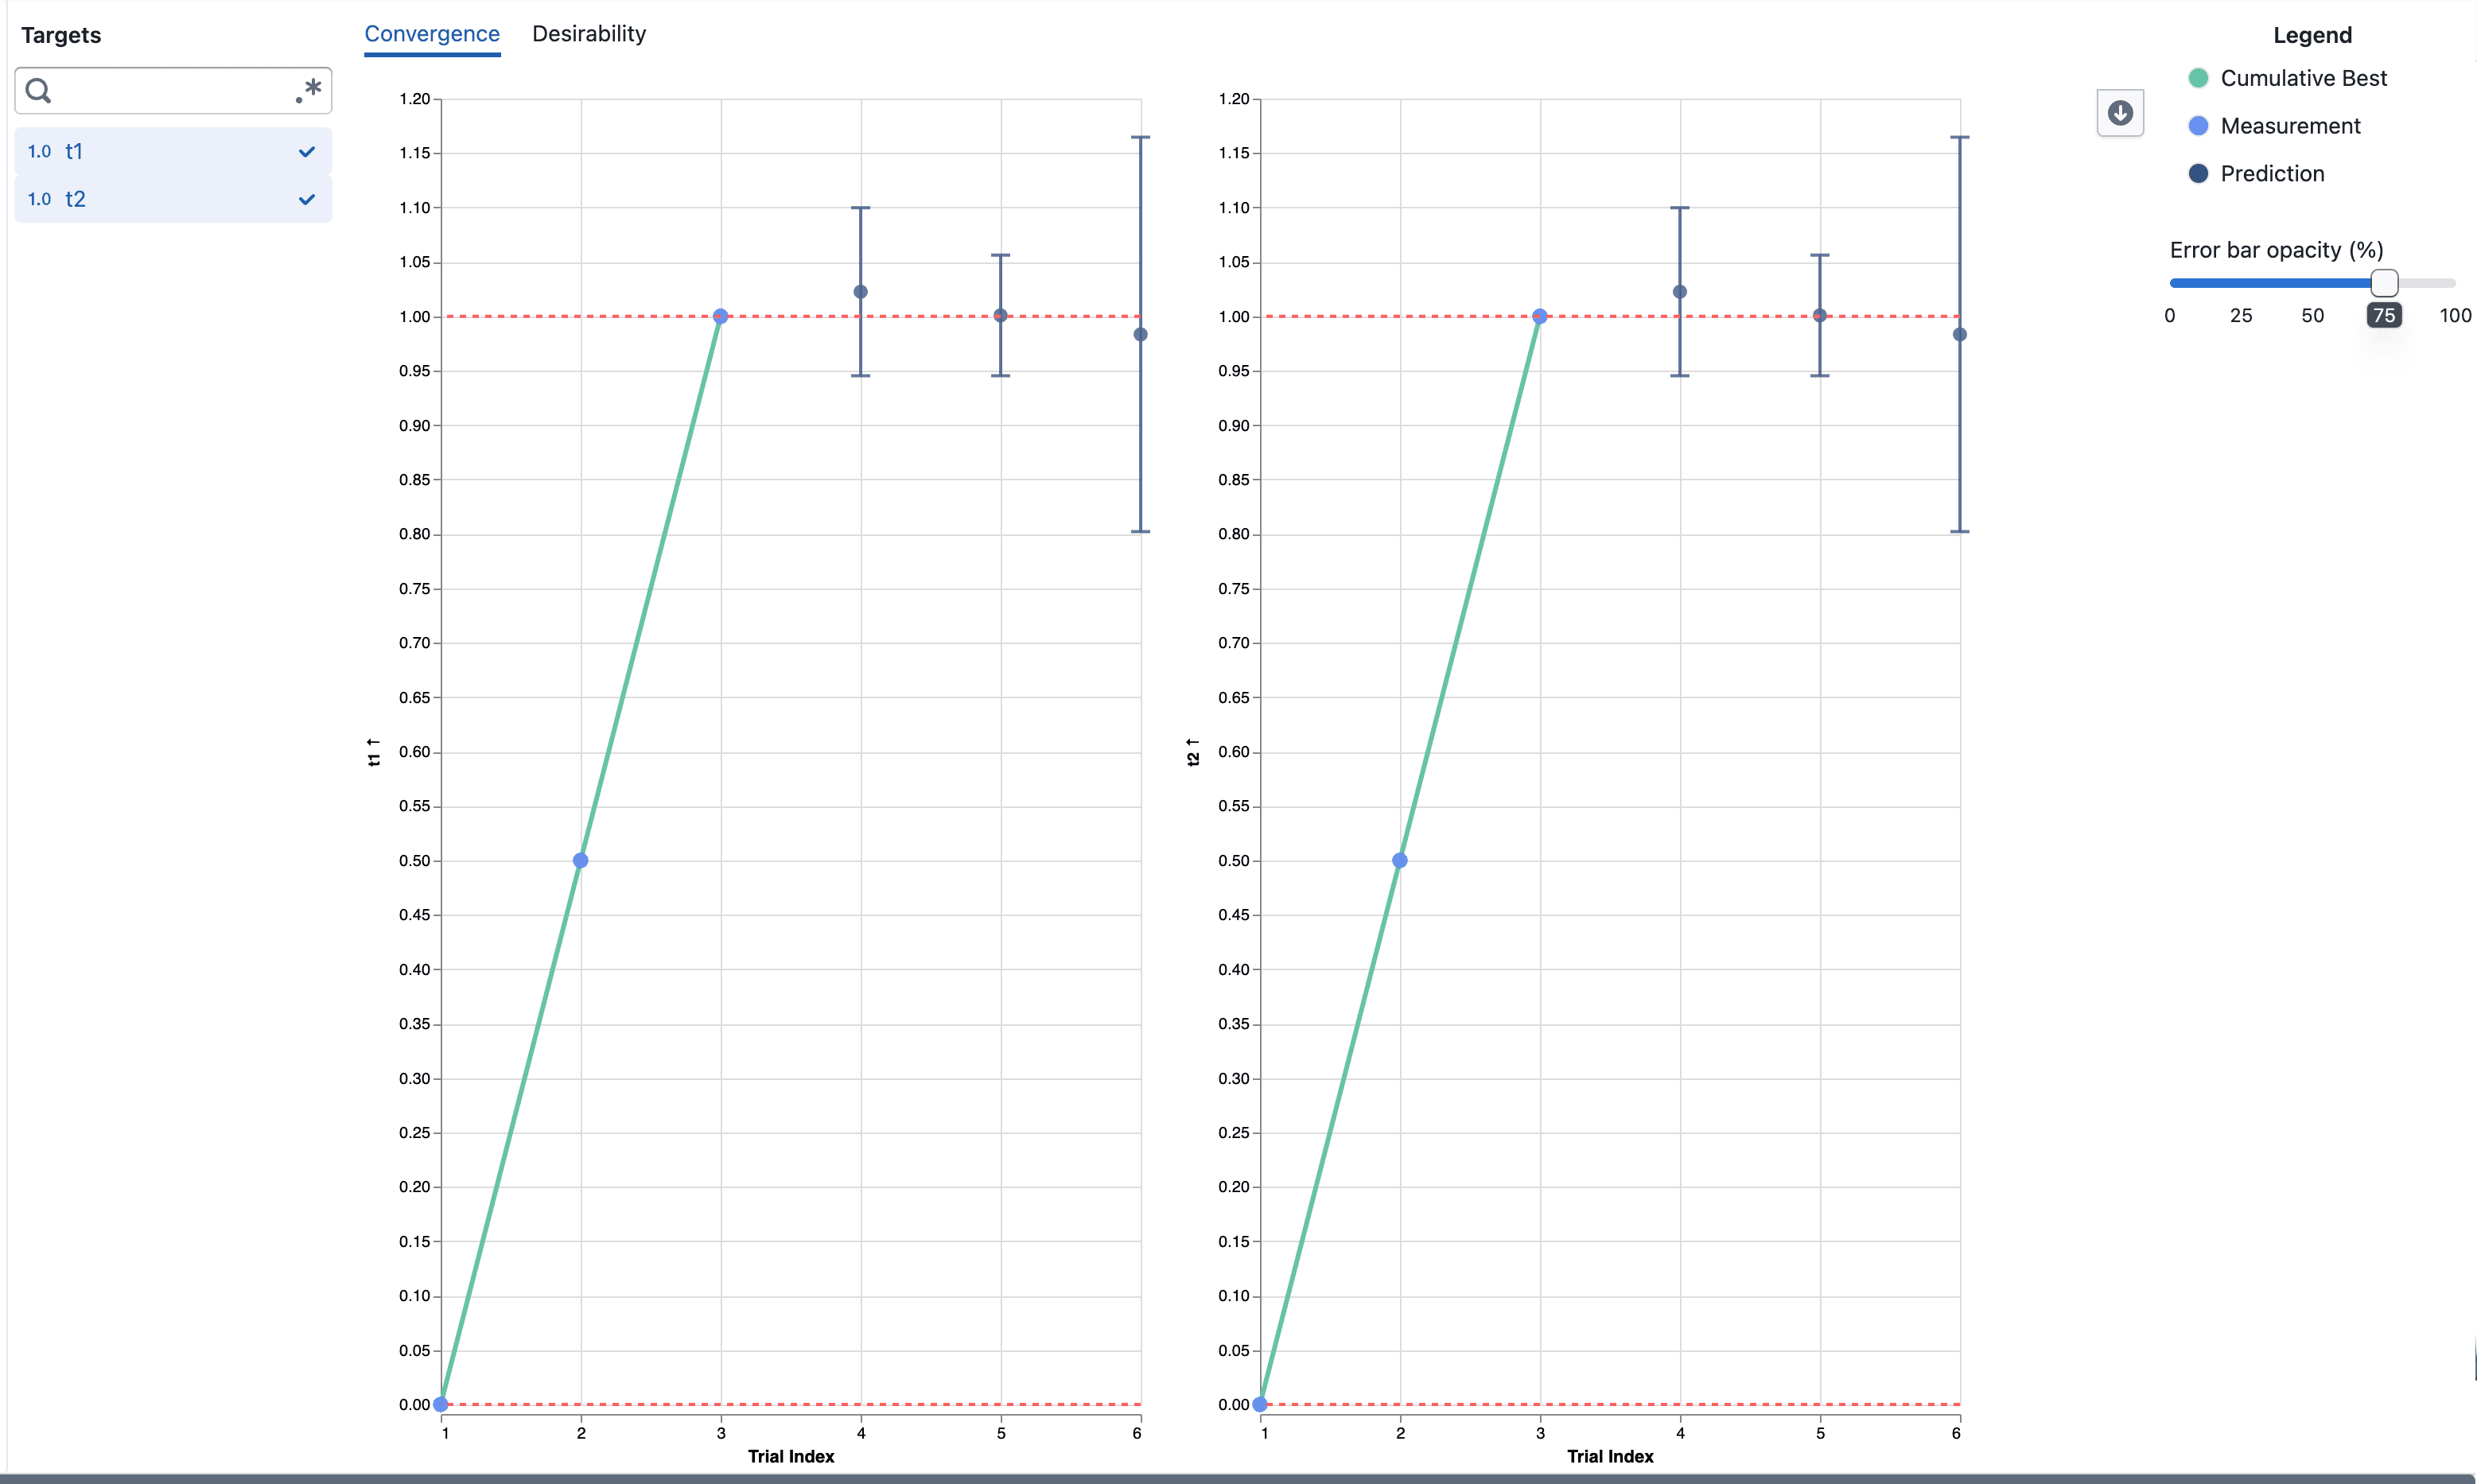
Predictions and error bars in the Convergence visualization

  • Prediction points appear alongside completed measurements on the same target axis
  • Error bars extend from mean − std to mean + std to show model uncertainty
  • Hover over a prediction to inspect its value and error-bar bounds
  • Use Error bar opacity (%) to adjust the visibility of the error bars, including hiding them at 0%

Notes​

  • Predictions are model estimates and are not measured target results
  • Error-bar bounds are not observed minimum and maximum values or a confidence interval

Sync Trials to Foundry Dataset

Sync your experiment trials to a linked Foundry dataset with one click, writing a snapshot of all trial data as a Parquet file.

What's included​

Sync button on the trials page​

The Views button in the study toolbar

A new Sync button sits in the top-right toolbar of the experiment trials page, next to the Add and Upload controls.

  • Click Sync to export all trials for the experiment to the linked Foundry dataset
  • The button shows a loading spinner while the sync runs and toasts the number of rows synced on completion
  • The button is disabled when there are no trials or no Foundry dataset is linked to the experiment

What gets synced​

  • Only trials where all parameters are complete are included, regardless of state
  • Each sync overwrites the previous snapshot

Notes​

  • The Sync button requires a Foundry dataset to be linked to the experiment at creation time
  • Each sync is a full snapshot — incremental/append writes are not currently supported

Saved Views for Plot and Correlations

Save and reapply chart configurations across Plot Builder and Correlation analysis. Build up a view by adding chart settings one tab at a time, then share a link to reproduce the exact setup.

What's included​

Views menu​

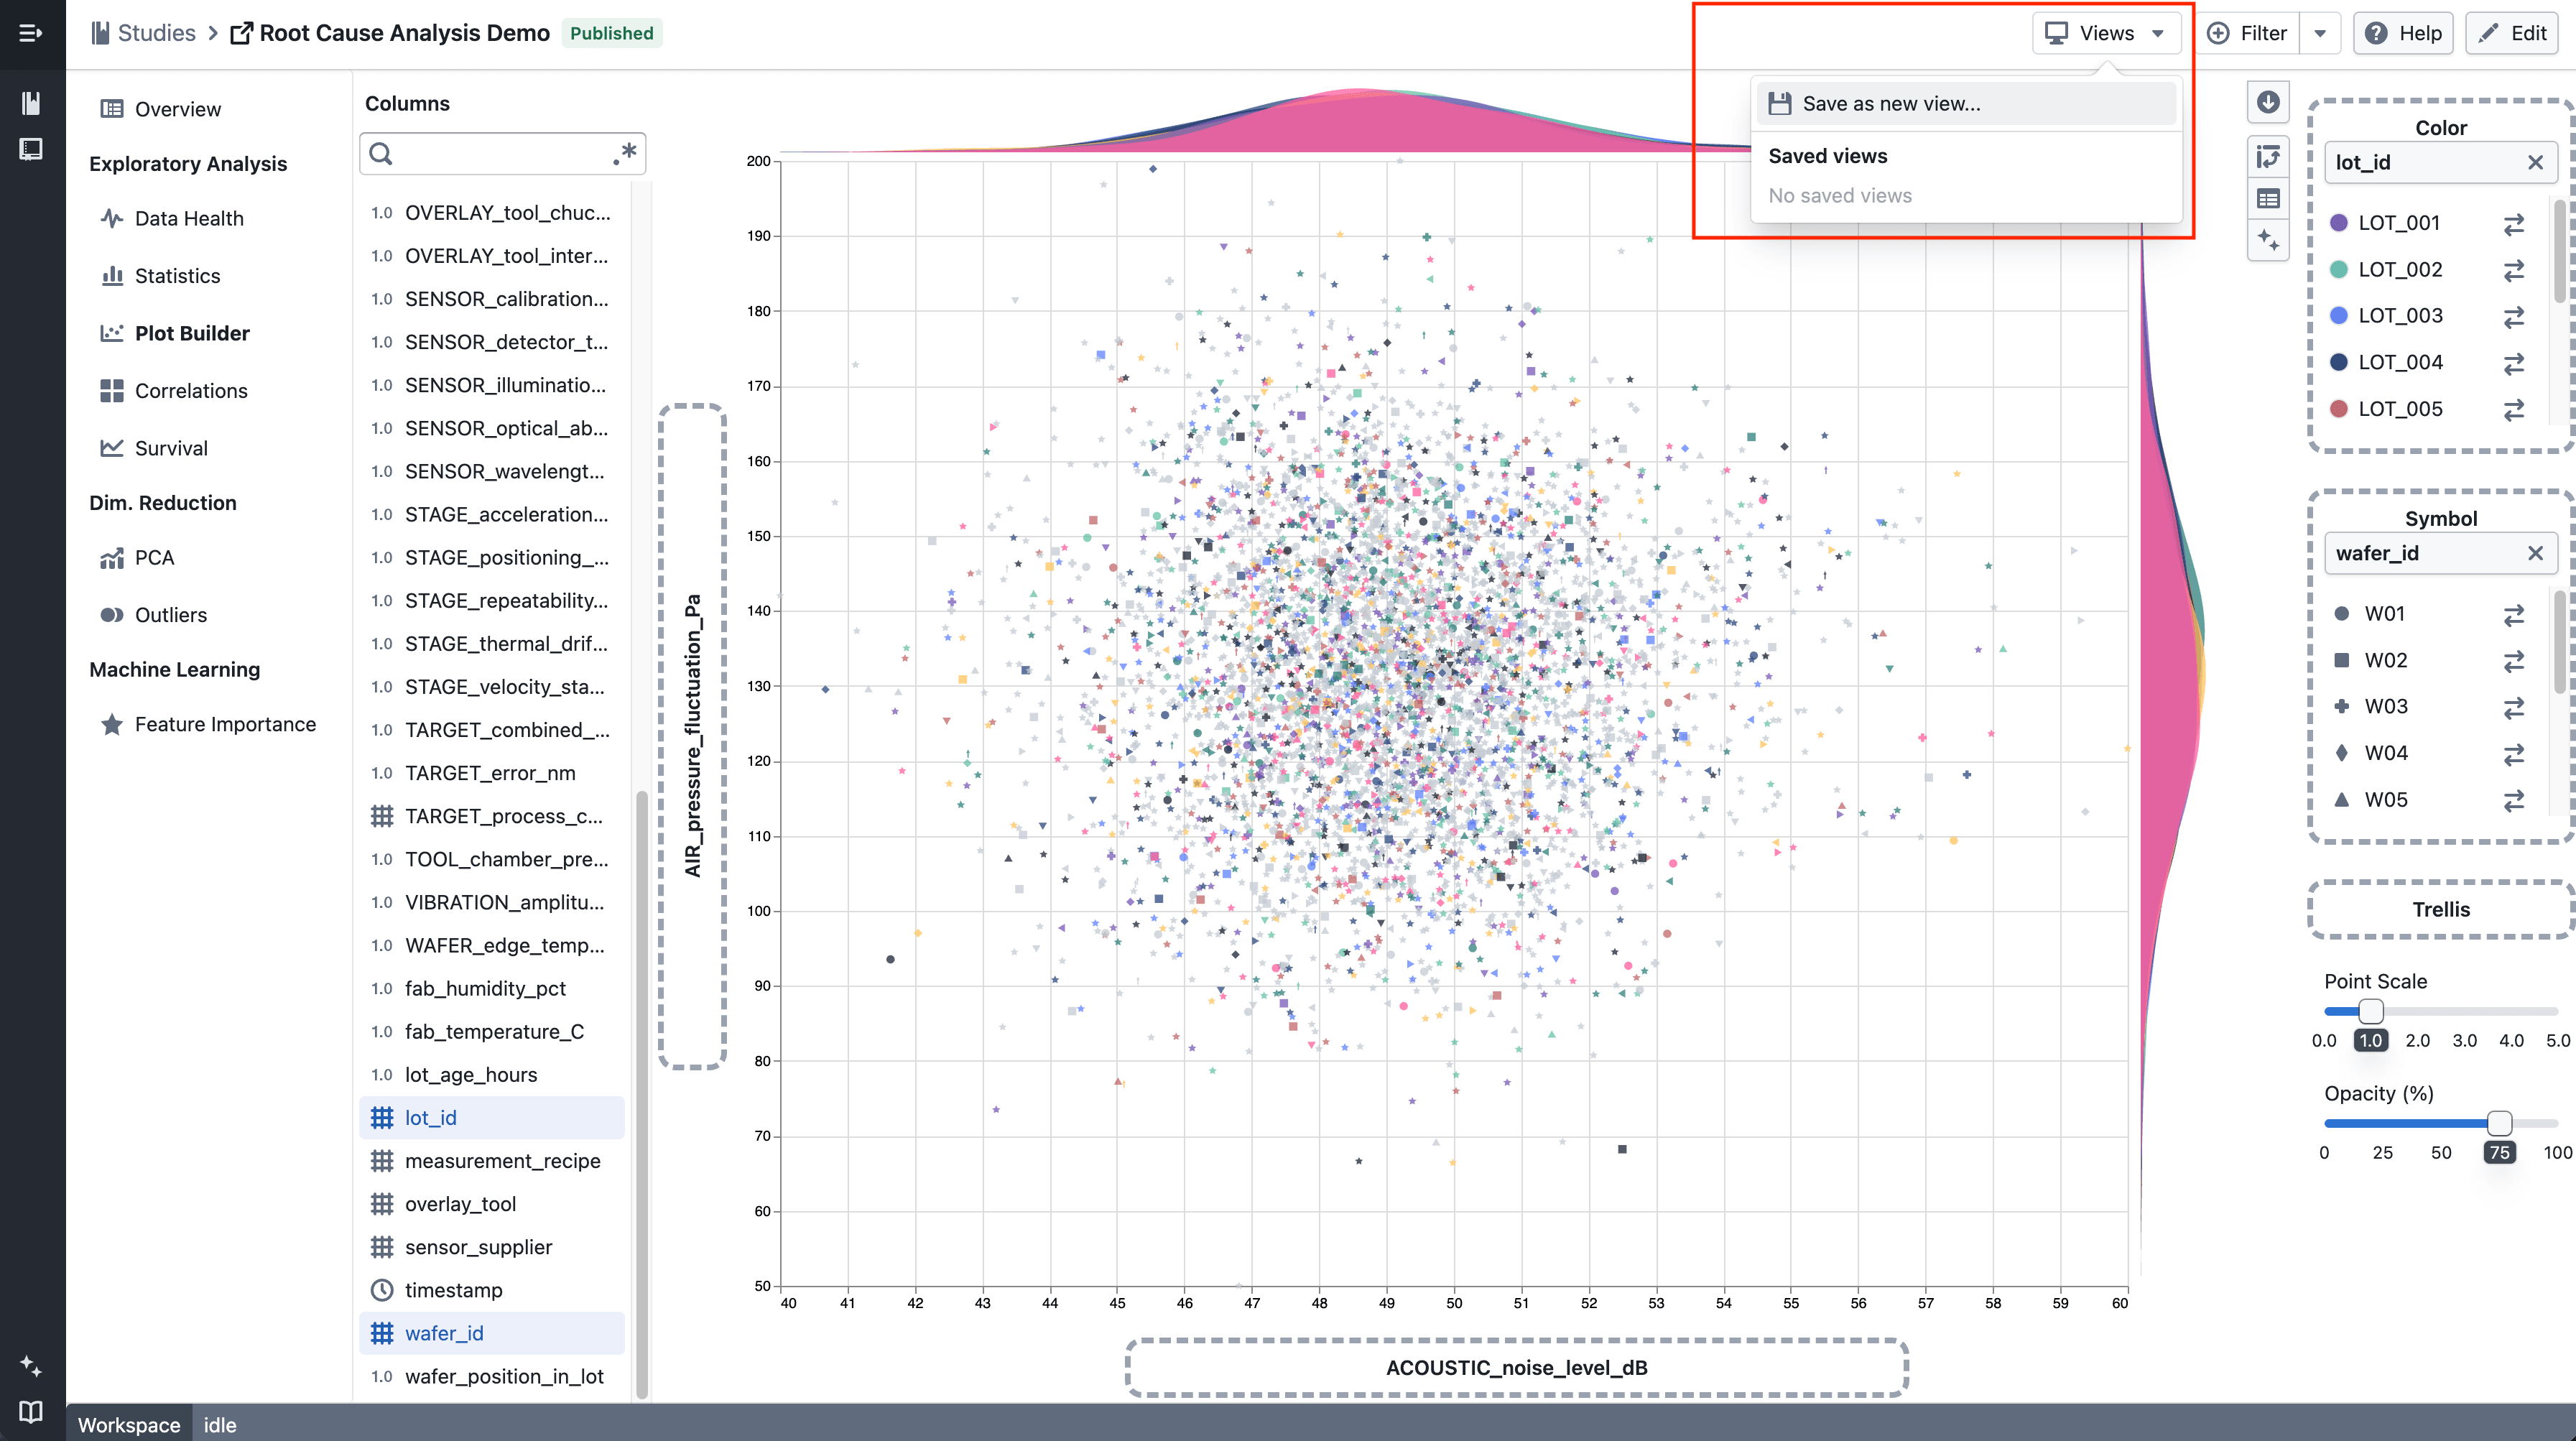
The Views button in the study toolbar

Use the Views button in the study toolbar to save, apply, and manage your chart configurations.

Save chart configurations as views​

Saving a new view from Plot Builder

  • Use Save as new view… to create a named view from your current chart configuration
  • Saved views are stored per study and can be selected, applied, and deleted at any time
  • Applying a view restores your axis selections, colour, symbol, and trellis encodings in Plot Builder, and your column and colour selections across all Correlation tabs

Build up a view across multiple charts​

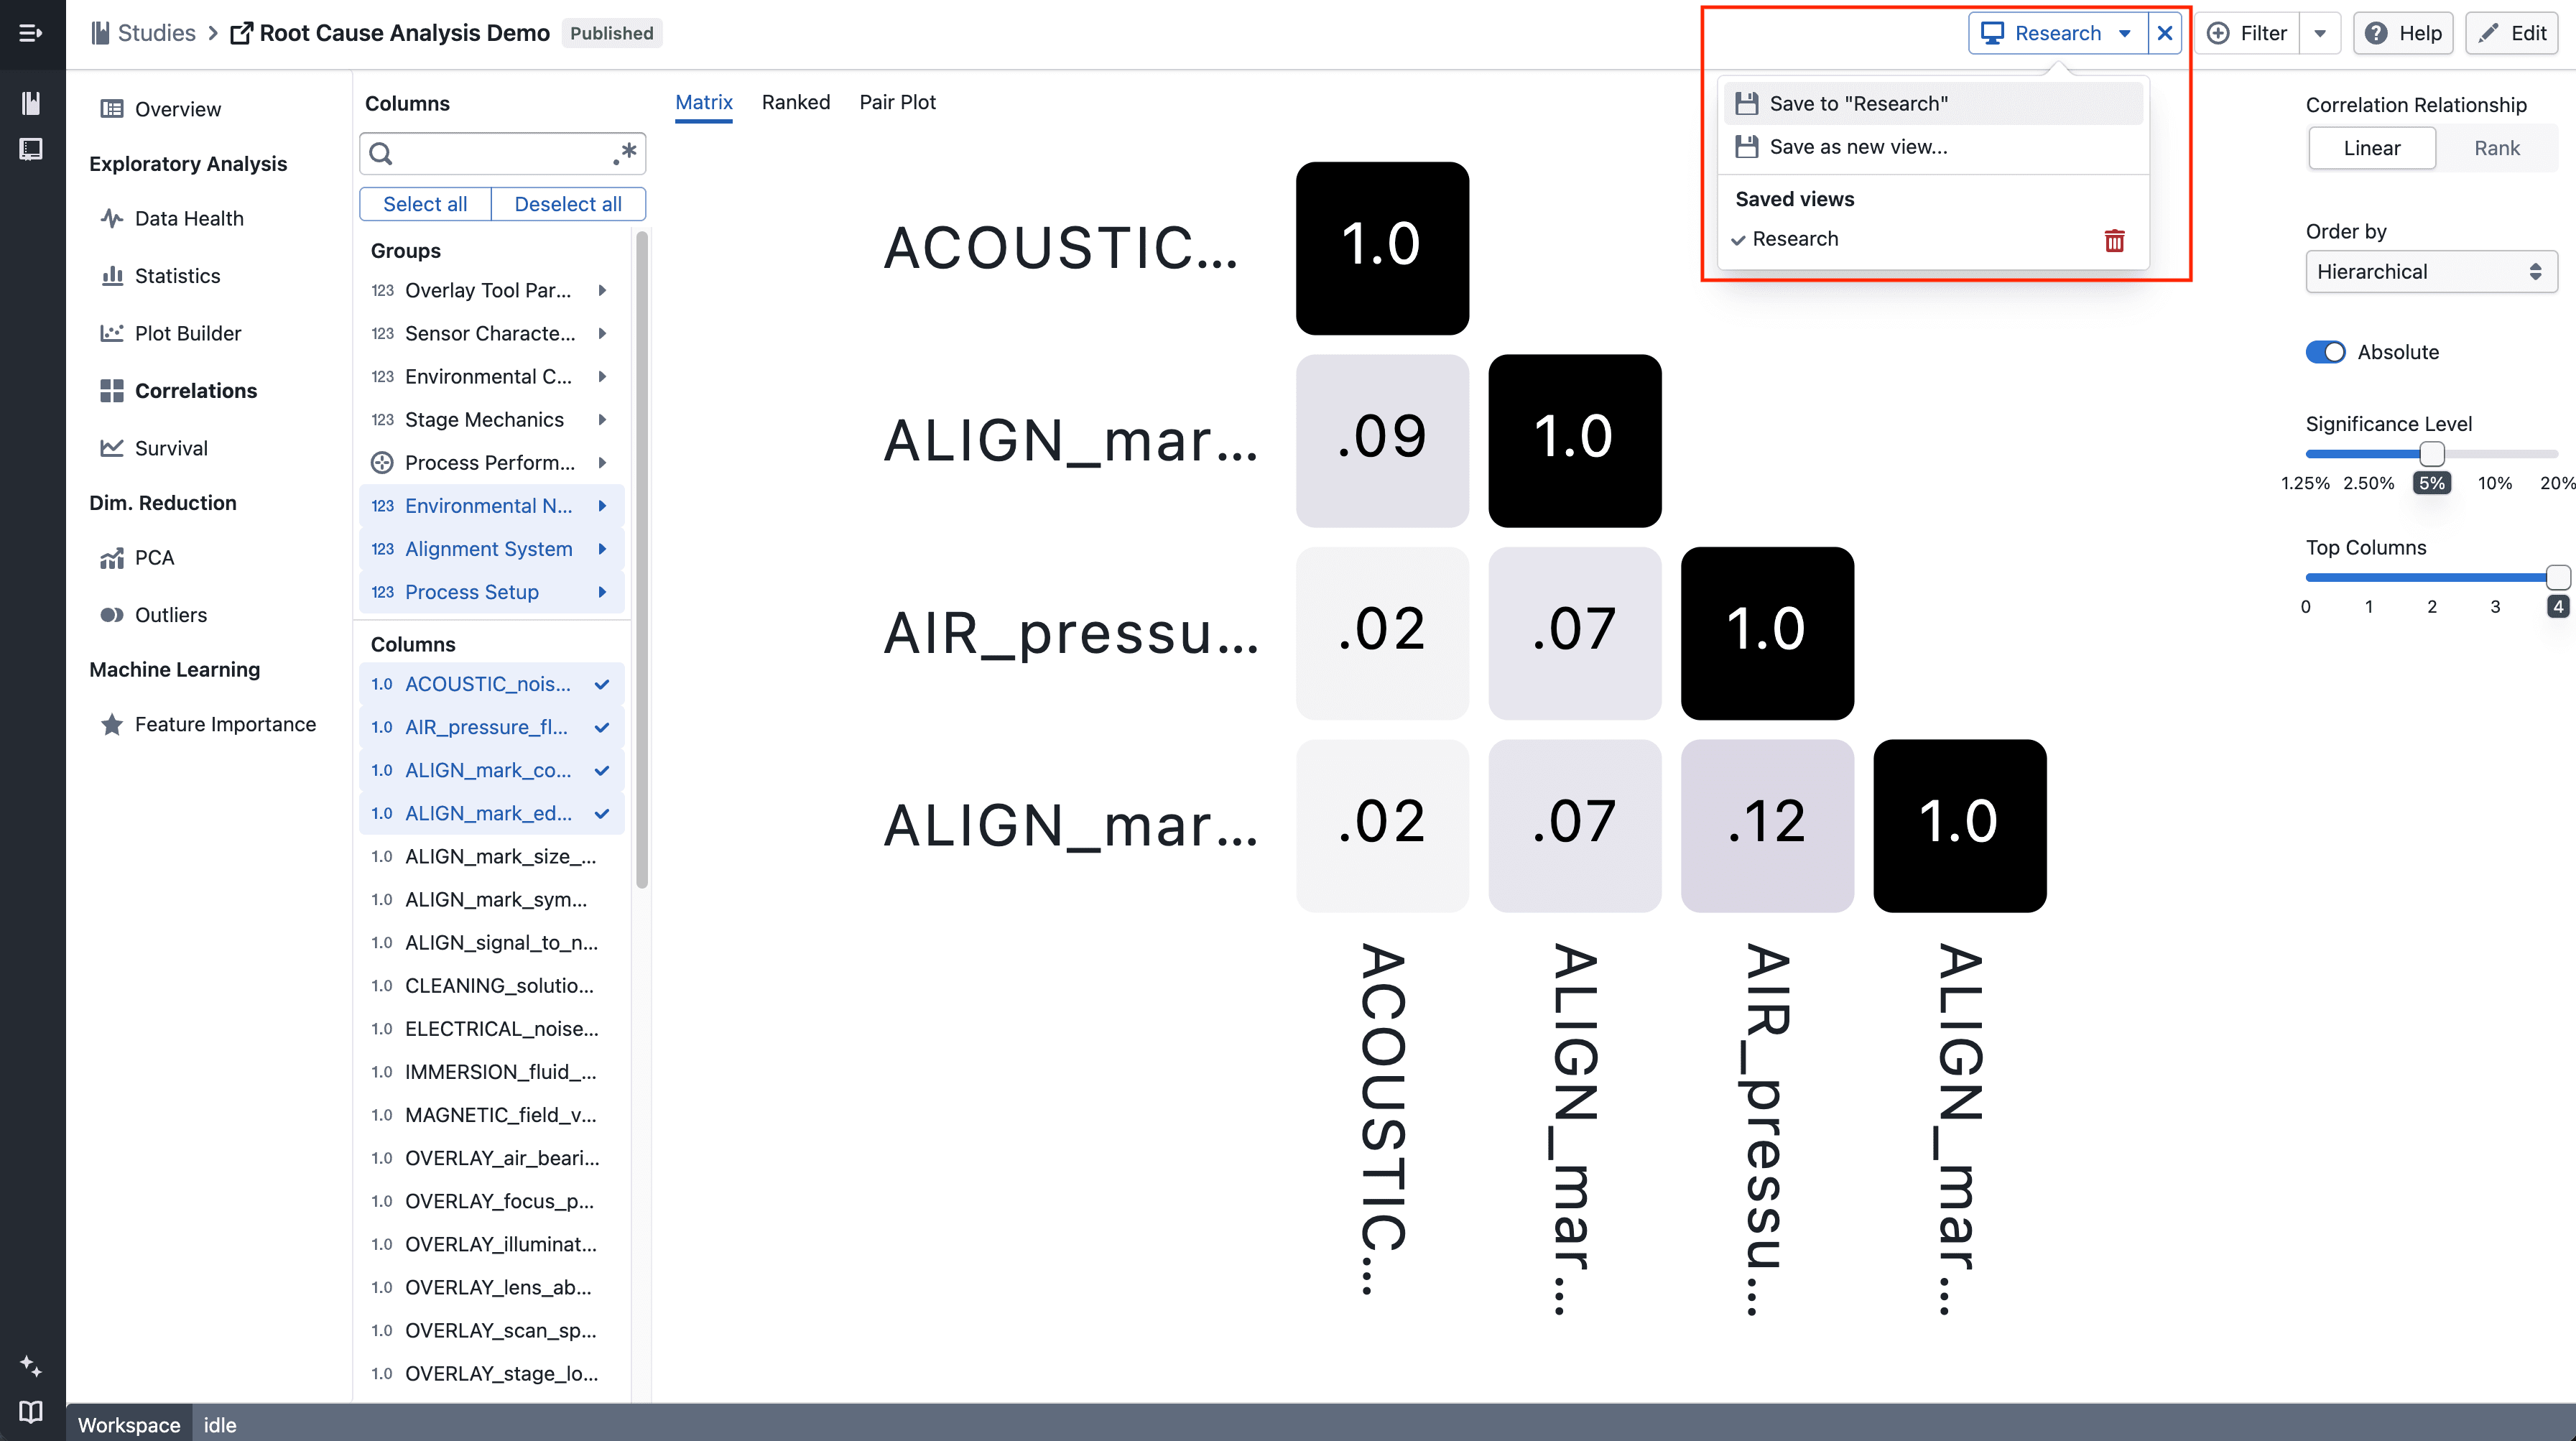
Adding correlation settings to an existing view

  • Each chart page (Plot Builder, Correlation Matrix, Correlation Ranked, Correlation Pair Plot) contributes its own configuration slot to a view
  • Use Save to "[view name]" to add or update the current page's settings into the active view without overwriting the other slots
  • Navigate between charts and keep saving to build up a view that spans multiple chart types

Share a view​

  • When a view is active, the URL contains a ?view= parameter — copy and share it to let a colleague open the same configuration directly
  • Views are study-scoped, so the recipient must have access to the study

Notes​

  • Correlation tab settings (columns, colour) are saved independently per tab type, so Matrix, Ranked, and Pair Plot each have their own slot within a view
  • Clearing a view (the × button next to the Views menu) returns each chart to its default state; it does not delete the saved view
  • Views currently work for Plot Builder and Correlation only — support for PCA, Survival, and other chart types is coming soon
  • This is an incremental update during beta

Assist Analyzes Your Study Data

Catalyst Assist can now answer questions about the data in your study — counts, averages, distributions, and filtered breakdowns — by querying the dataset directly.

What's included​

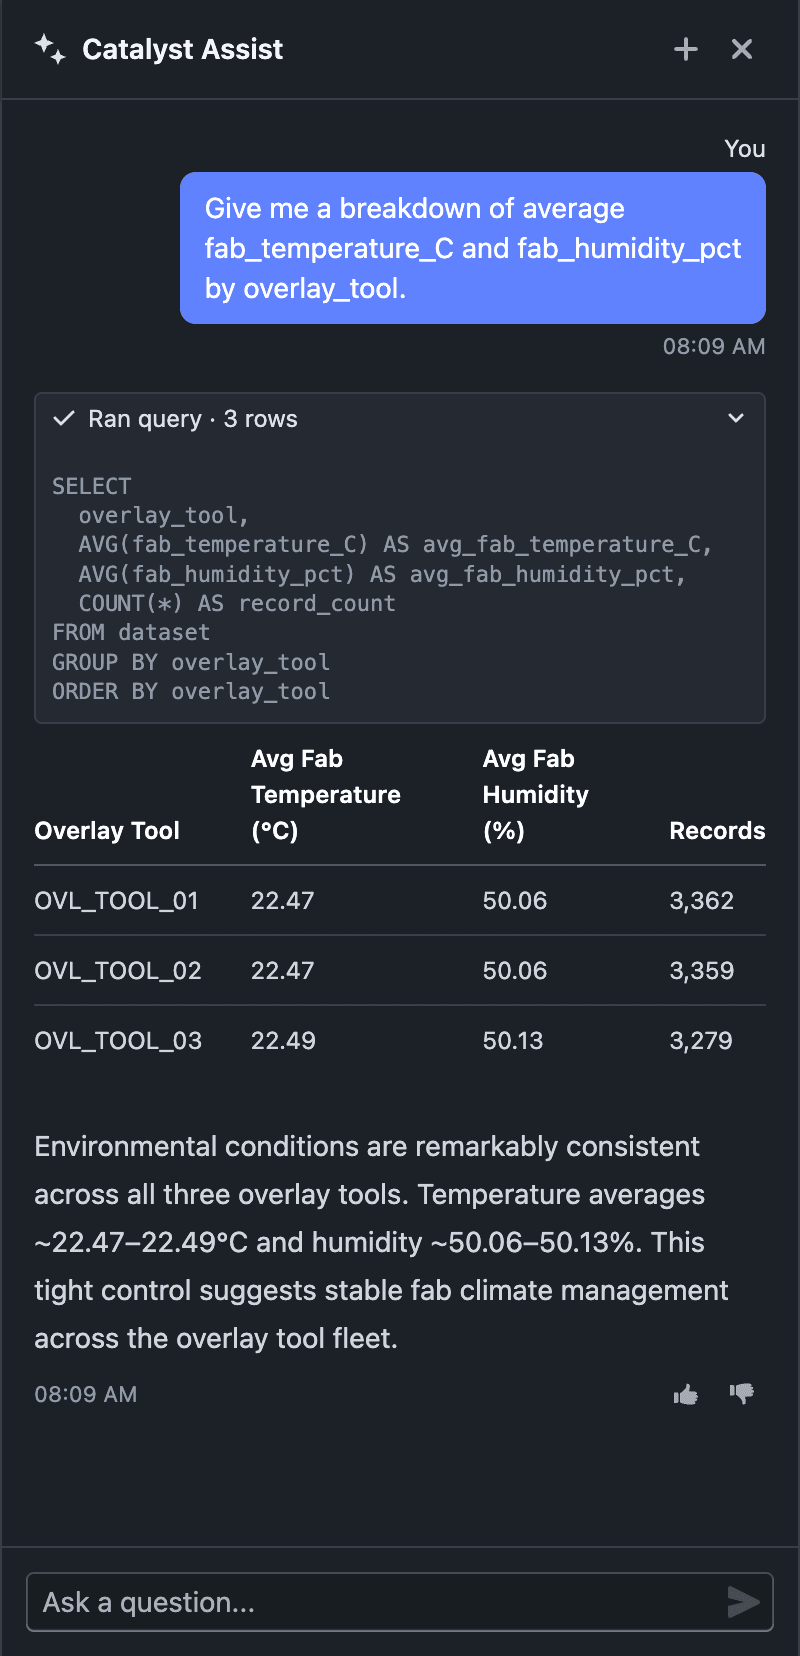
Catalyst Assist answering a data question with figures and a table

  • Ask data questions in natural language — "average overlay error by tool?", "how many wafers failed process control?", "distribution of risk score by lot" — and Assist queries your study dataset to answer
  • Answers are computed from your actual data, returned as markdown tables, with a brief takeaway drawn from the results
  • Date and duration math is supported — group by year, compare timestamps, measure elapsed time between events
  • Platform and feature questions still work exactly as before — Assist picks the right mode for each question

Notes​

  • Data answers come only from your dataset — Assist never invents, estimates, or extrapolates figures
  • Data questions are available when Assist is opened from within a study
  • Data queries run on the study's worker, so it must be provisioned and active; otherwise Assist still answers platform and feature questions but can't query the dataset
  • AI responses may not always be accurate. If you receive an unexpected result, let us know with the thumbs up/down on the response, or share it via Support → Contact Support
  • This is an incremental update during beta

Improved Folder Picker

The folder picker is now easier to navigate, supports deeper search drill-down, and lets you create folders in the right place.

What’s included​

Easier folder navigation​

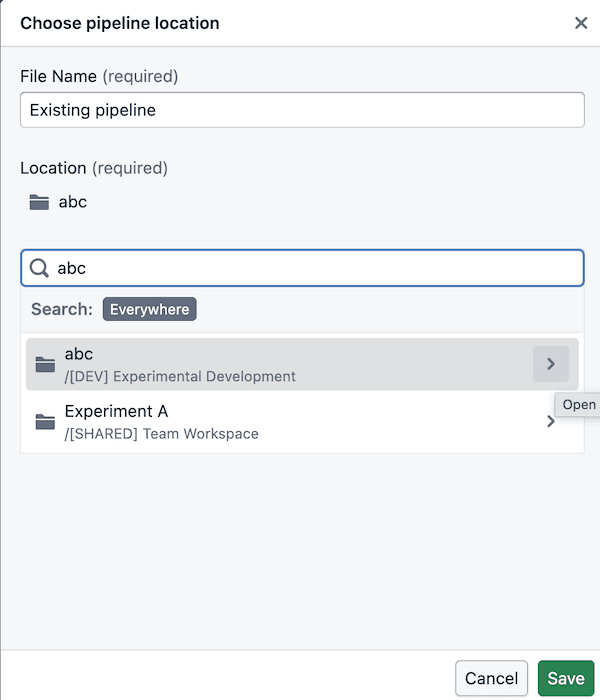
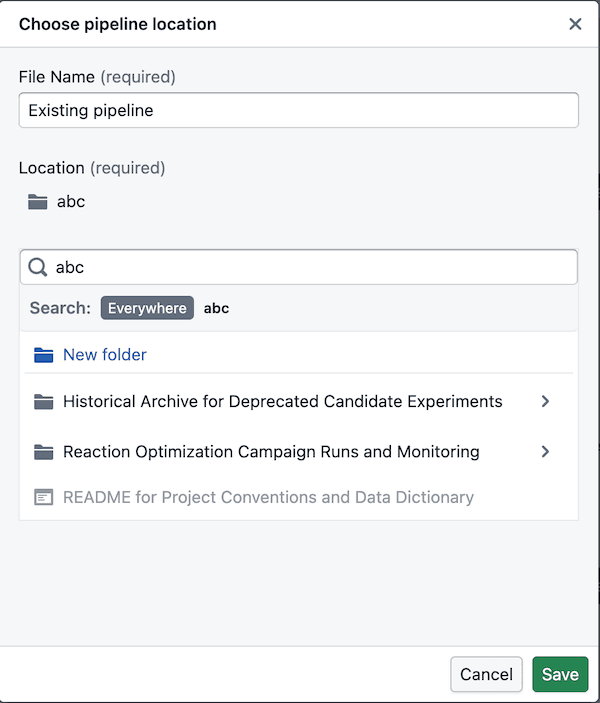
Search folder navigation Search folder navigation creation

  • You can now drill into folders directly from search results instead of starting over in the main tree
  • Search breadcrumbs stay clickable, so it’s easier to move back up when you’ve drilled in
  • Search results only show folders you can actually use, so there’s less dead-end clicking

Folder creation in the right place​

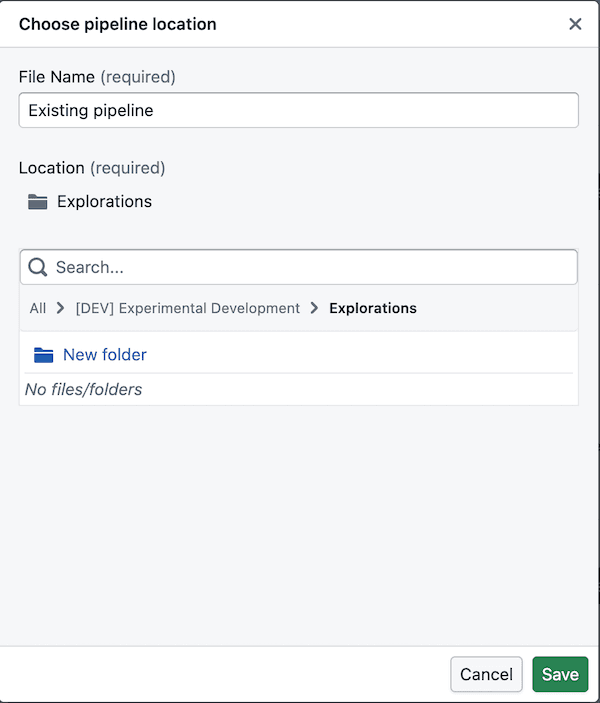
Folder creation

  • The picker follows the same folder structure used in Foundry: space -> project -> folders
  • A space is like a shared drive, and its first-level listings are project resources
  • Admins manage projects, so you can browse into them but cannot create new folders at the project level itself
  • You can create folders once you’re inside the folders within a project, including after drilling in from search

Notes​

  • Folder creation is only available once you’ve drilled into a valid folder location inside a project
  • If a folder does not appear in search, you may not have permission to use it

Catalyst Assist

Ask questions about Catalyst and get instant, documentation-backed answers — right from the sidebar.

What's included​

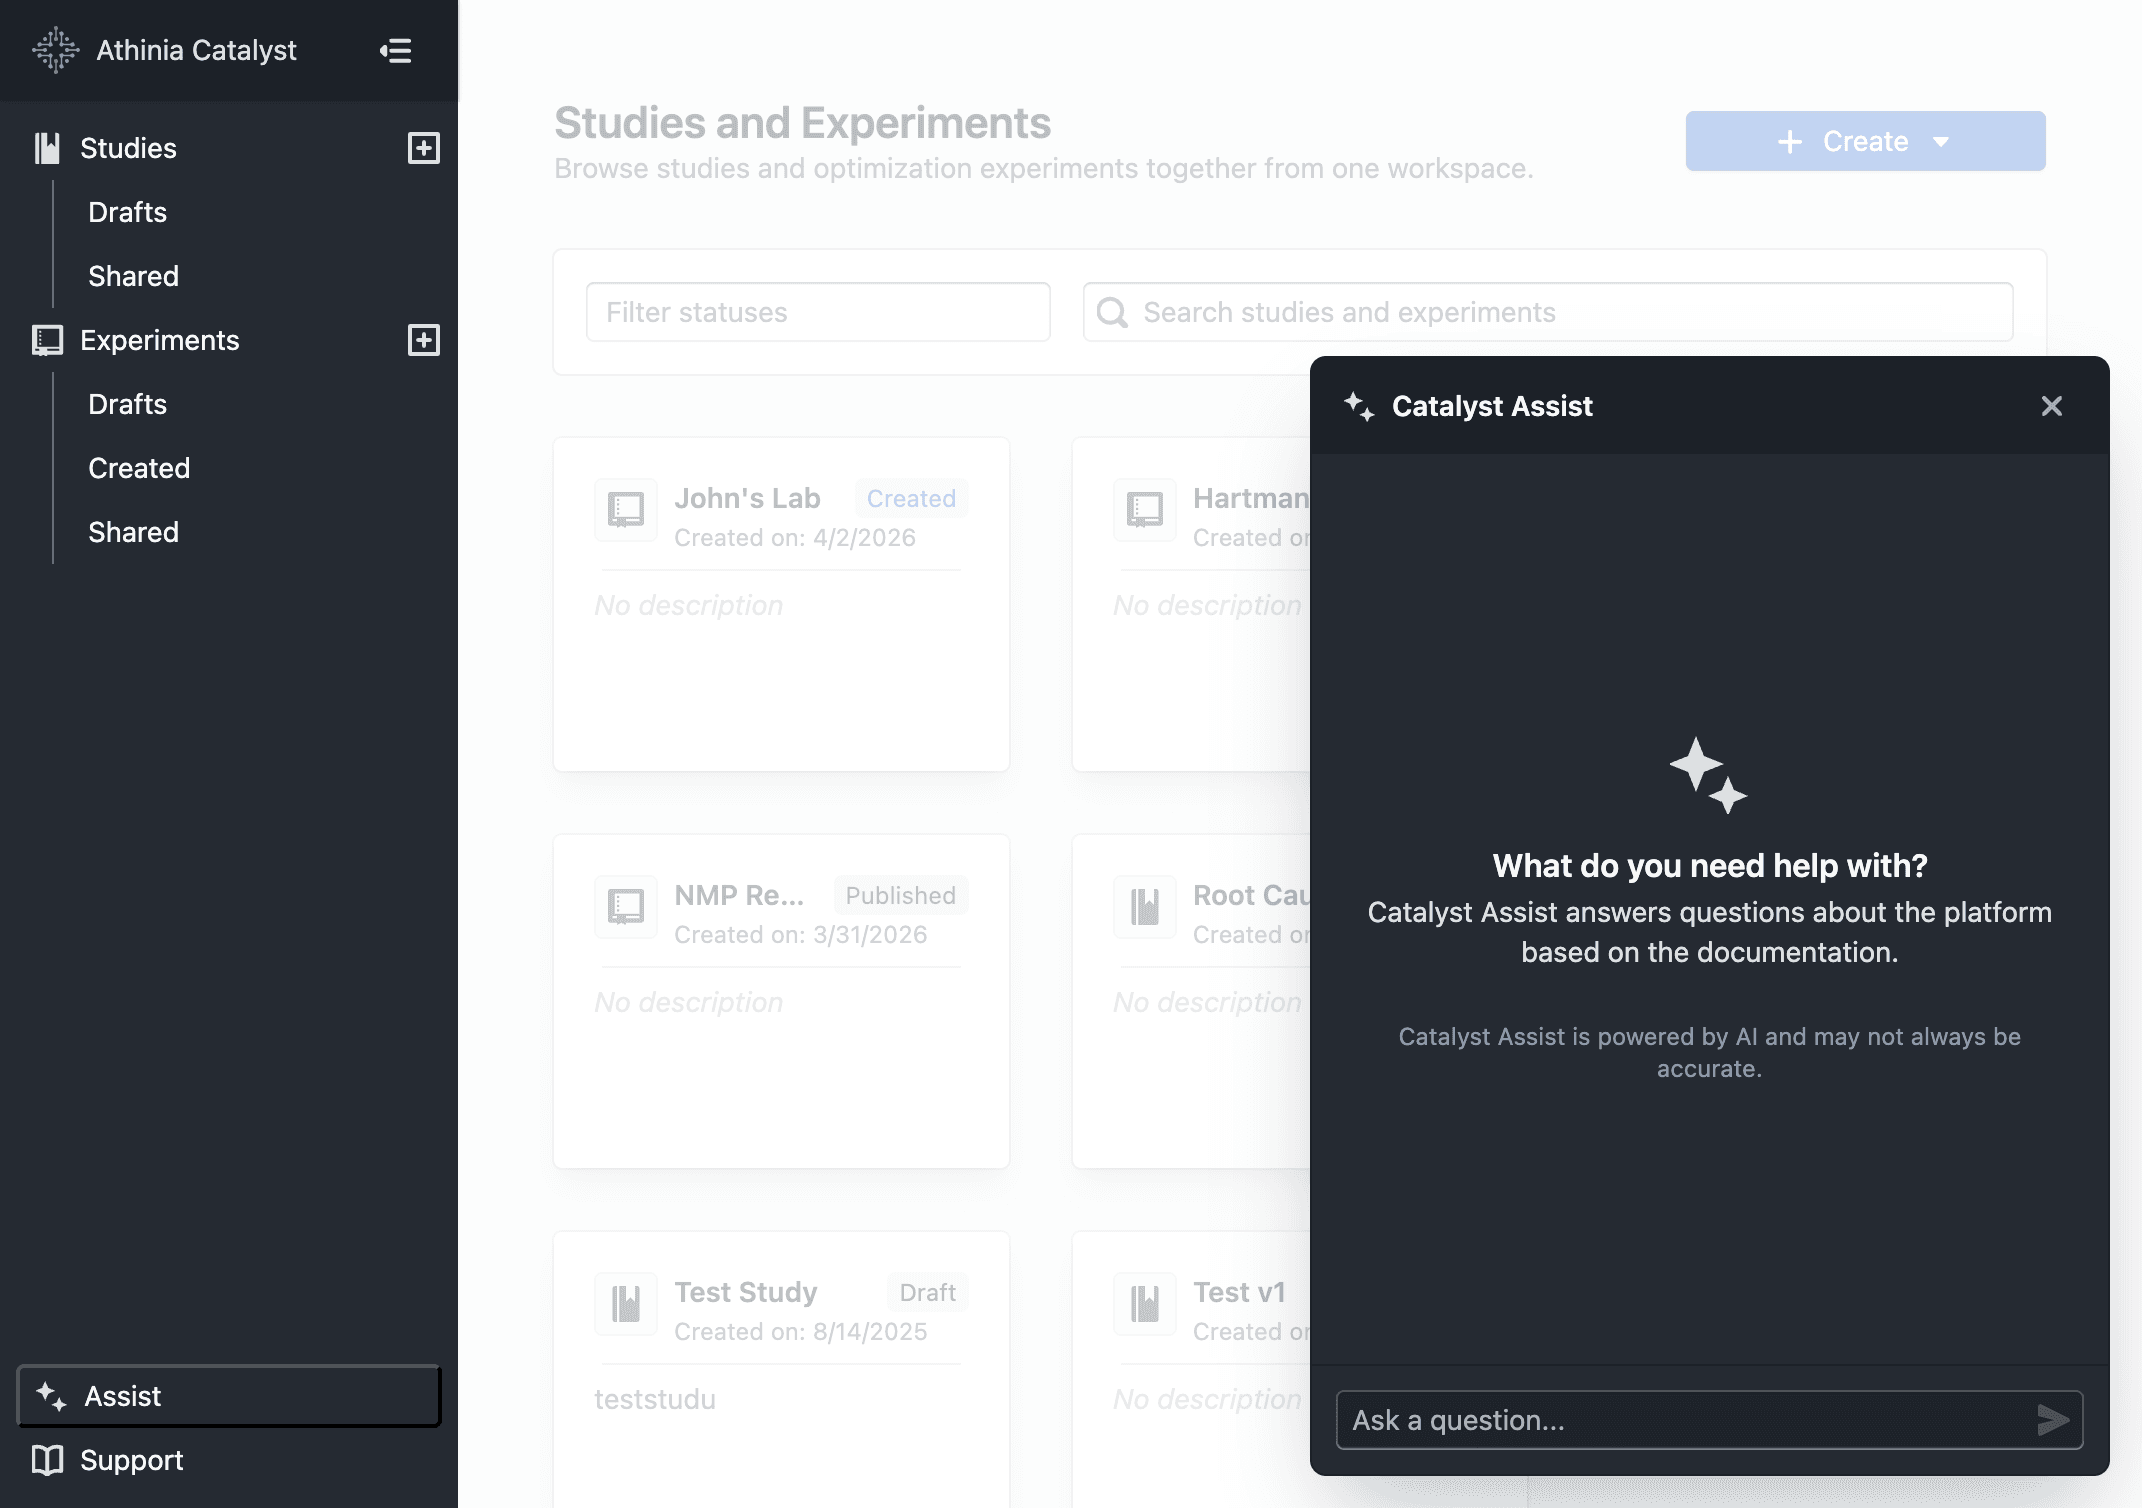
Catalyst Assist panel open alongside the dashboard

  • Click Assist in the sidebar to open the panel from any page
  • Ask a question and receive a focused, markdown-formatted answer grounded in Catalyst documentation
  • Source excerpts are shown beneath each reply so you can verify or explore further
  • Follow-up questions are supported — prior context is carried forward within the same conversation
  • Use the + button to start a new conversation at any time

Notes​

  • Answers are based solely on Catalyst documentation — the assistant will not speculate or invent features
  • AI responses may not always be accurate. When in doubt, refer to the official documentation for authoritative guidance
  • If you receive an unexpected or unhelpful response, please share it via Support → Contact Support
  • Conversations are limited to 20 messages; start a new one for unrelated topics