Sigma-Based PCA Clusters

Create PCA clusters from sigma bands and compare only clusters that contain points.

What's included​

Create clusters from sigma bands​

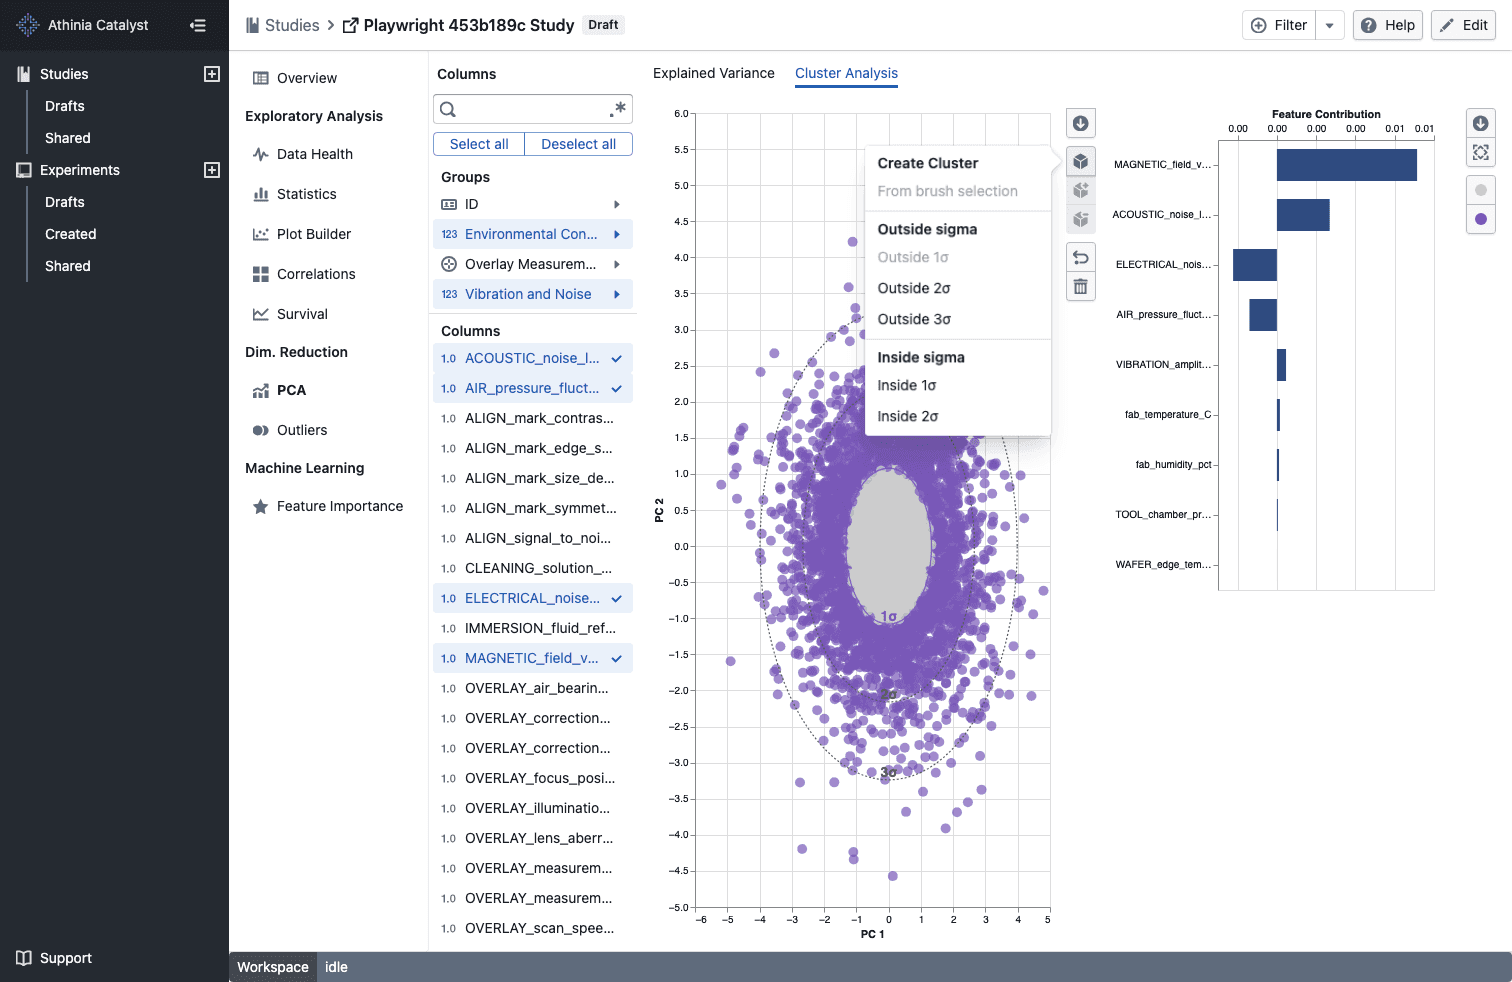
Sigma-based PCA clusters

  • Open the cluster menu in PCA -> Cluster Analysis to create ready-made Inside nσ and Outside nσ clusters without drawing a brush
  • Sigma-based clusters automatically assign matching points as soon as the PCA view finishes loading
  • The matching sigma contour adopts the cluster color so you can see the selected boundary at a glance

Compare populated clusters only​

  • Cluster comparison menus now show only clusters that currently contain points
  • If a selected cluster becomes empty or is removed, the comparison updates to the next valid populated cluster automatically

Notes​

  • Sigma-based clusters are stored with your other PCA cluster selections for that study
  • Outside nσ options are available for every displayed sigma band, while Inside nσ options are available for the inner bands
  • Empty clusters are excluded from comparison choices until they contain points
Contact Support

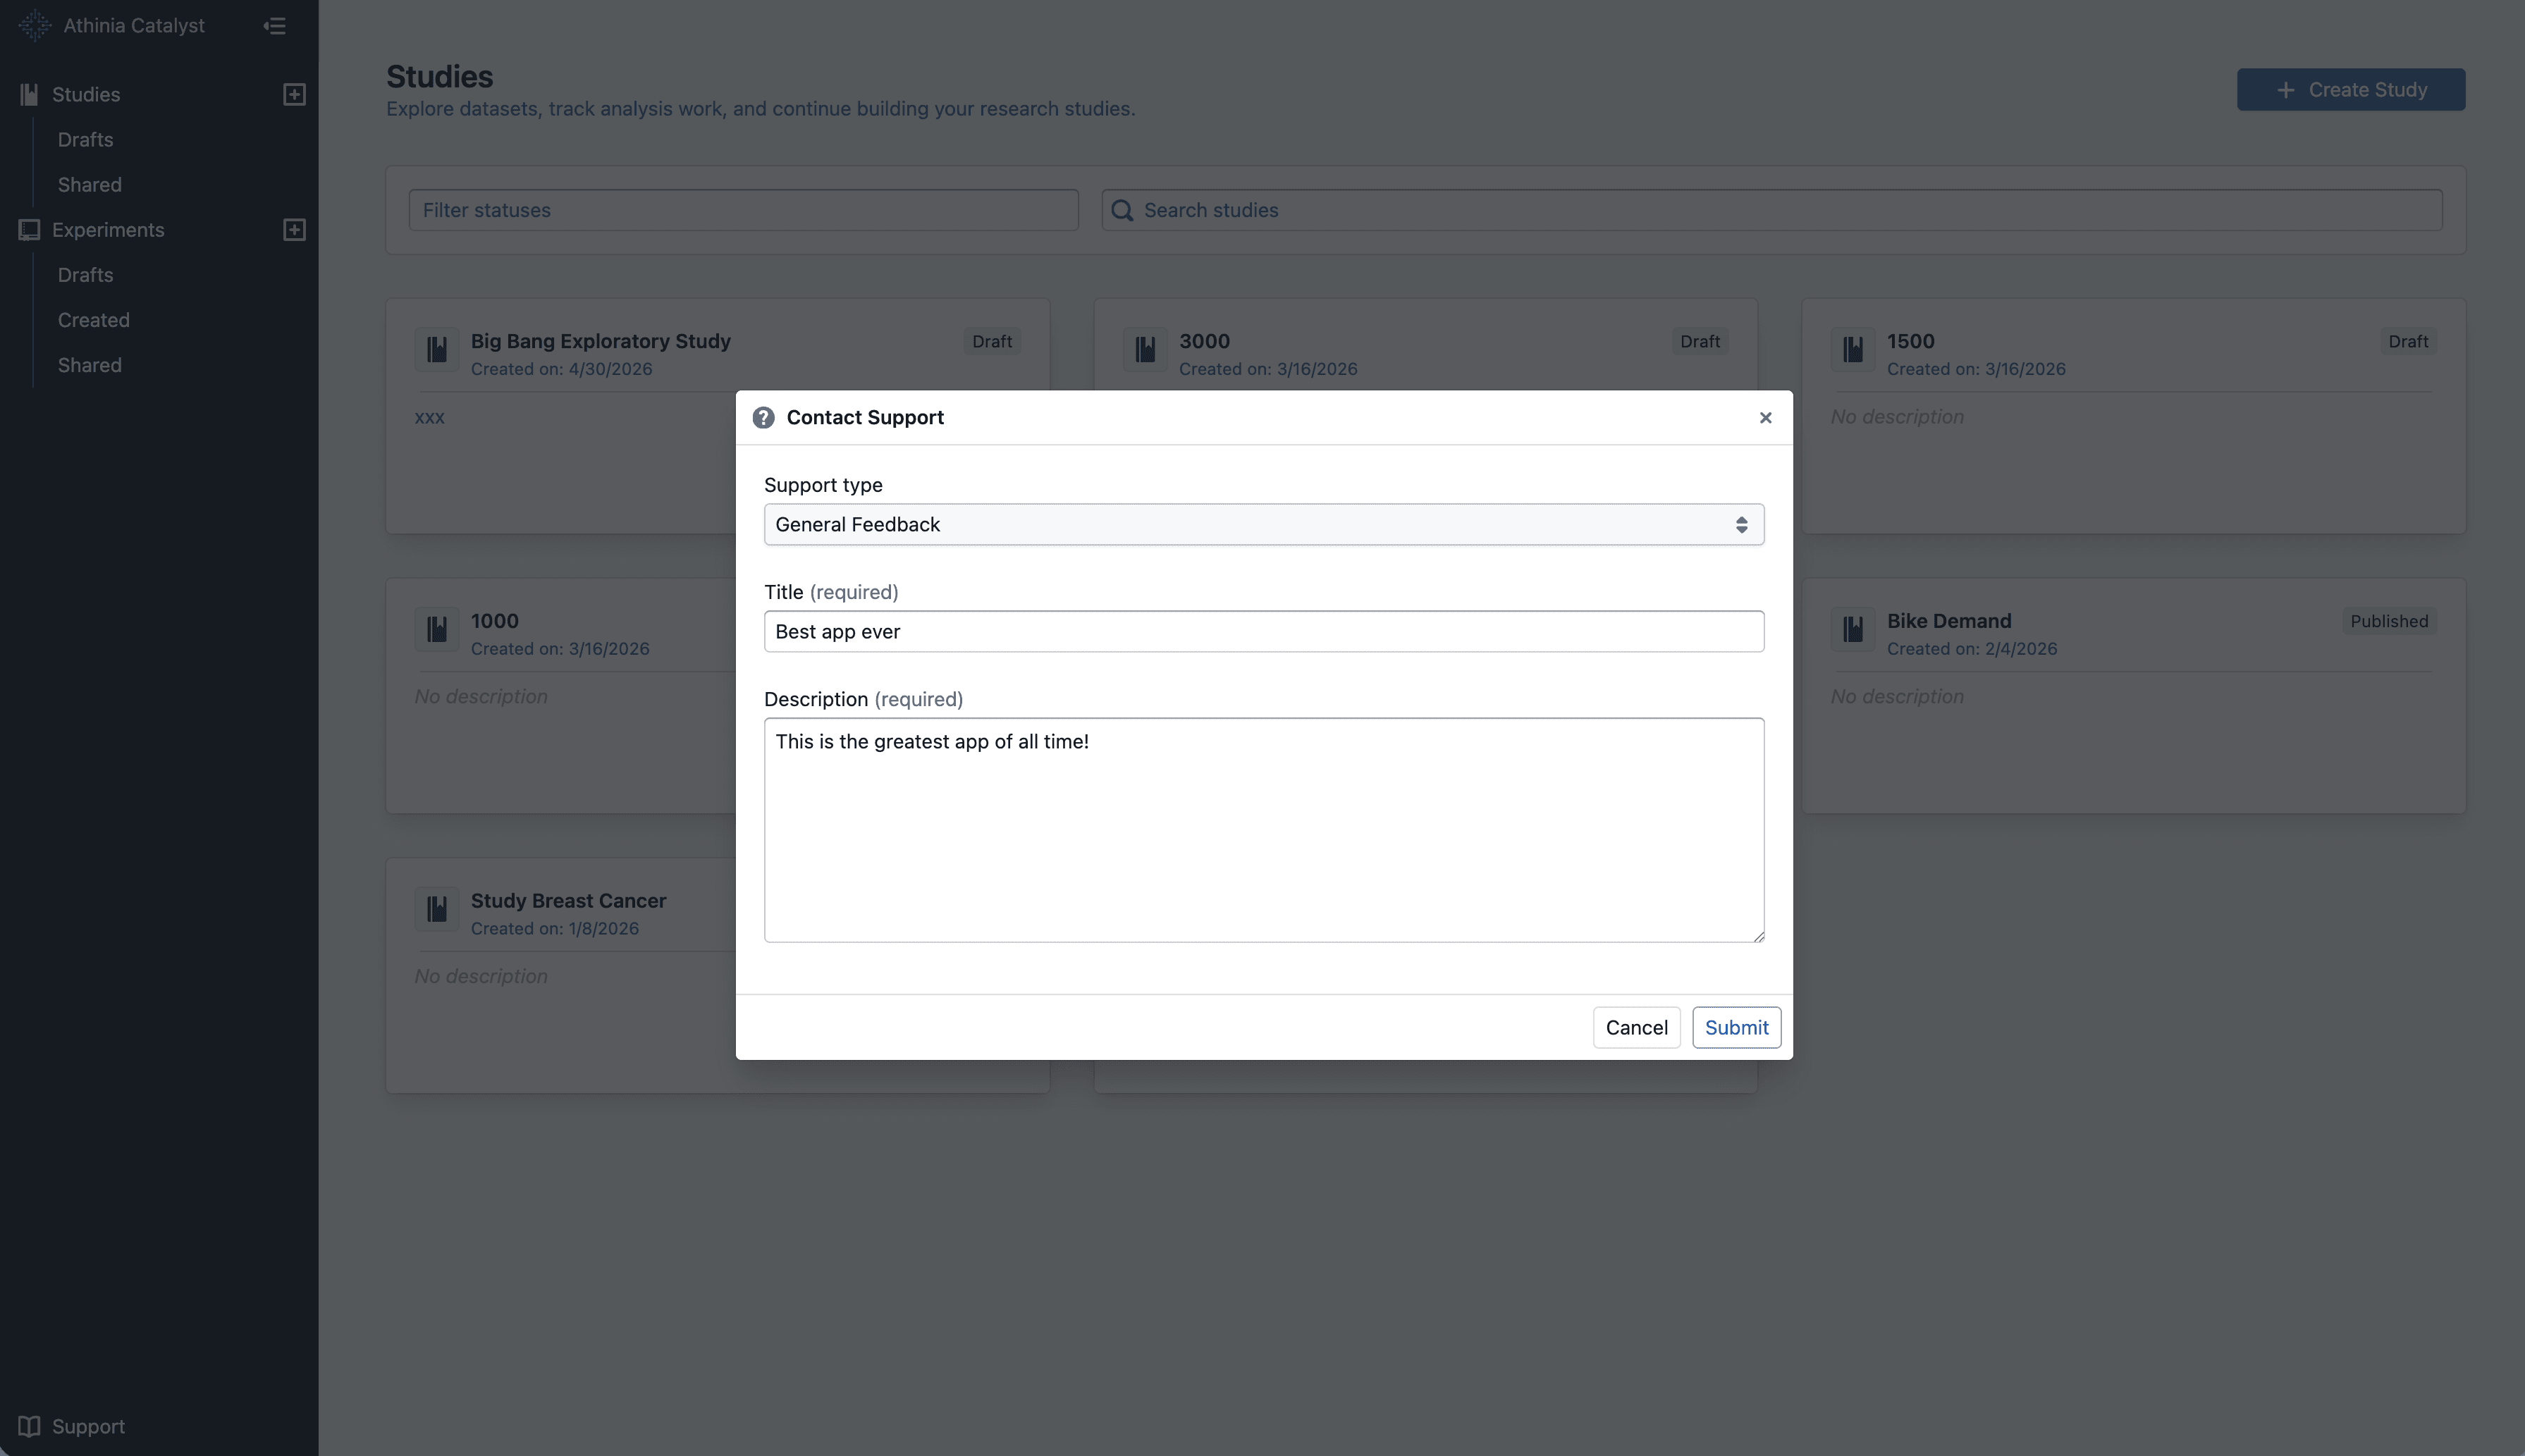
Send feedback, bug reports, and feature requests directly from the Support menu.

What's included​

Contact Support from anywhere​

Contact Support dialog

  • Open Support -> Contact Support from the app sidebar without leaving your current page
  • Submit one of three request types: General Feedback, Bug Report, or Feature Request

Faster issue triage​

  • Add a clear title and detailed description so the team can understand your request faster
  • Your submission includes your current page, browser, and account details to reduce back-and-forth

Notes​

  • The form requires both a title and description before you can submit
  • Messages are limited to 1,500 characters
  • For bug reports, include steps to reproduce and what you expected to happen

Exclude Columns in Data Health & Column Settings

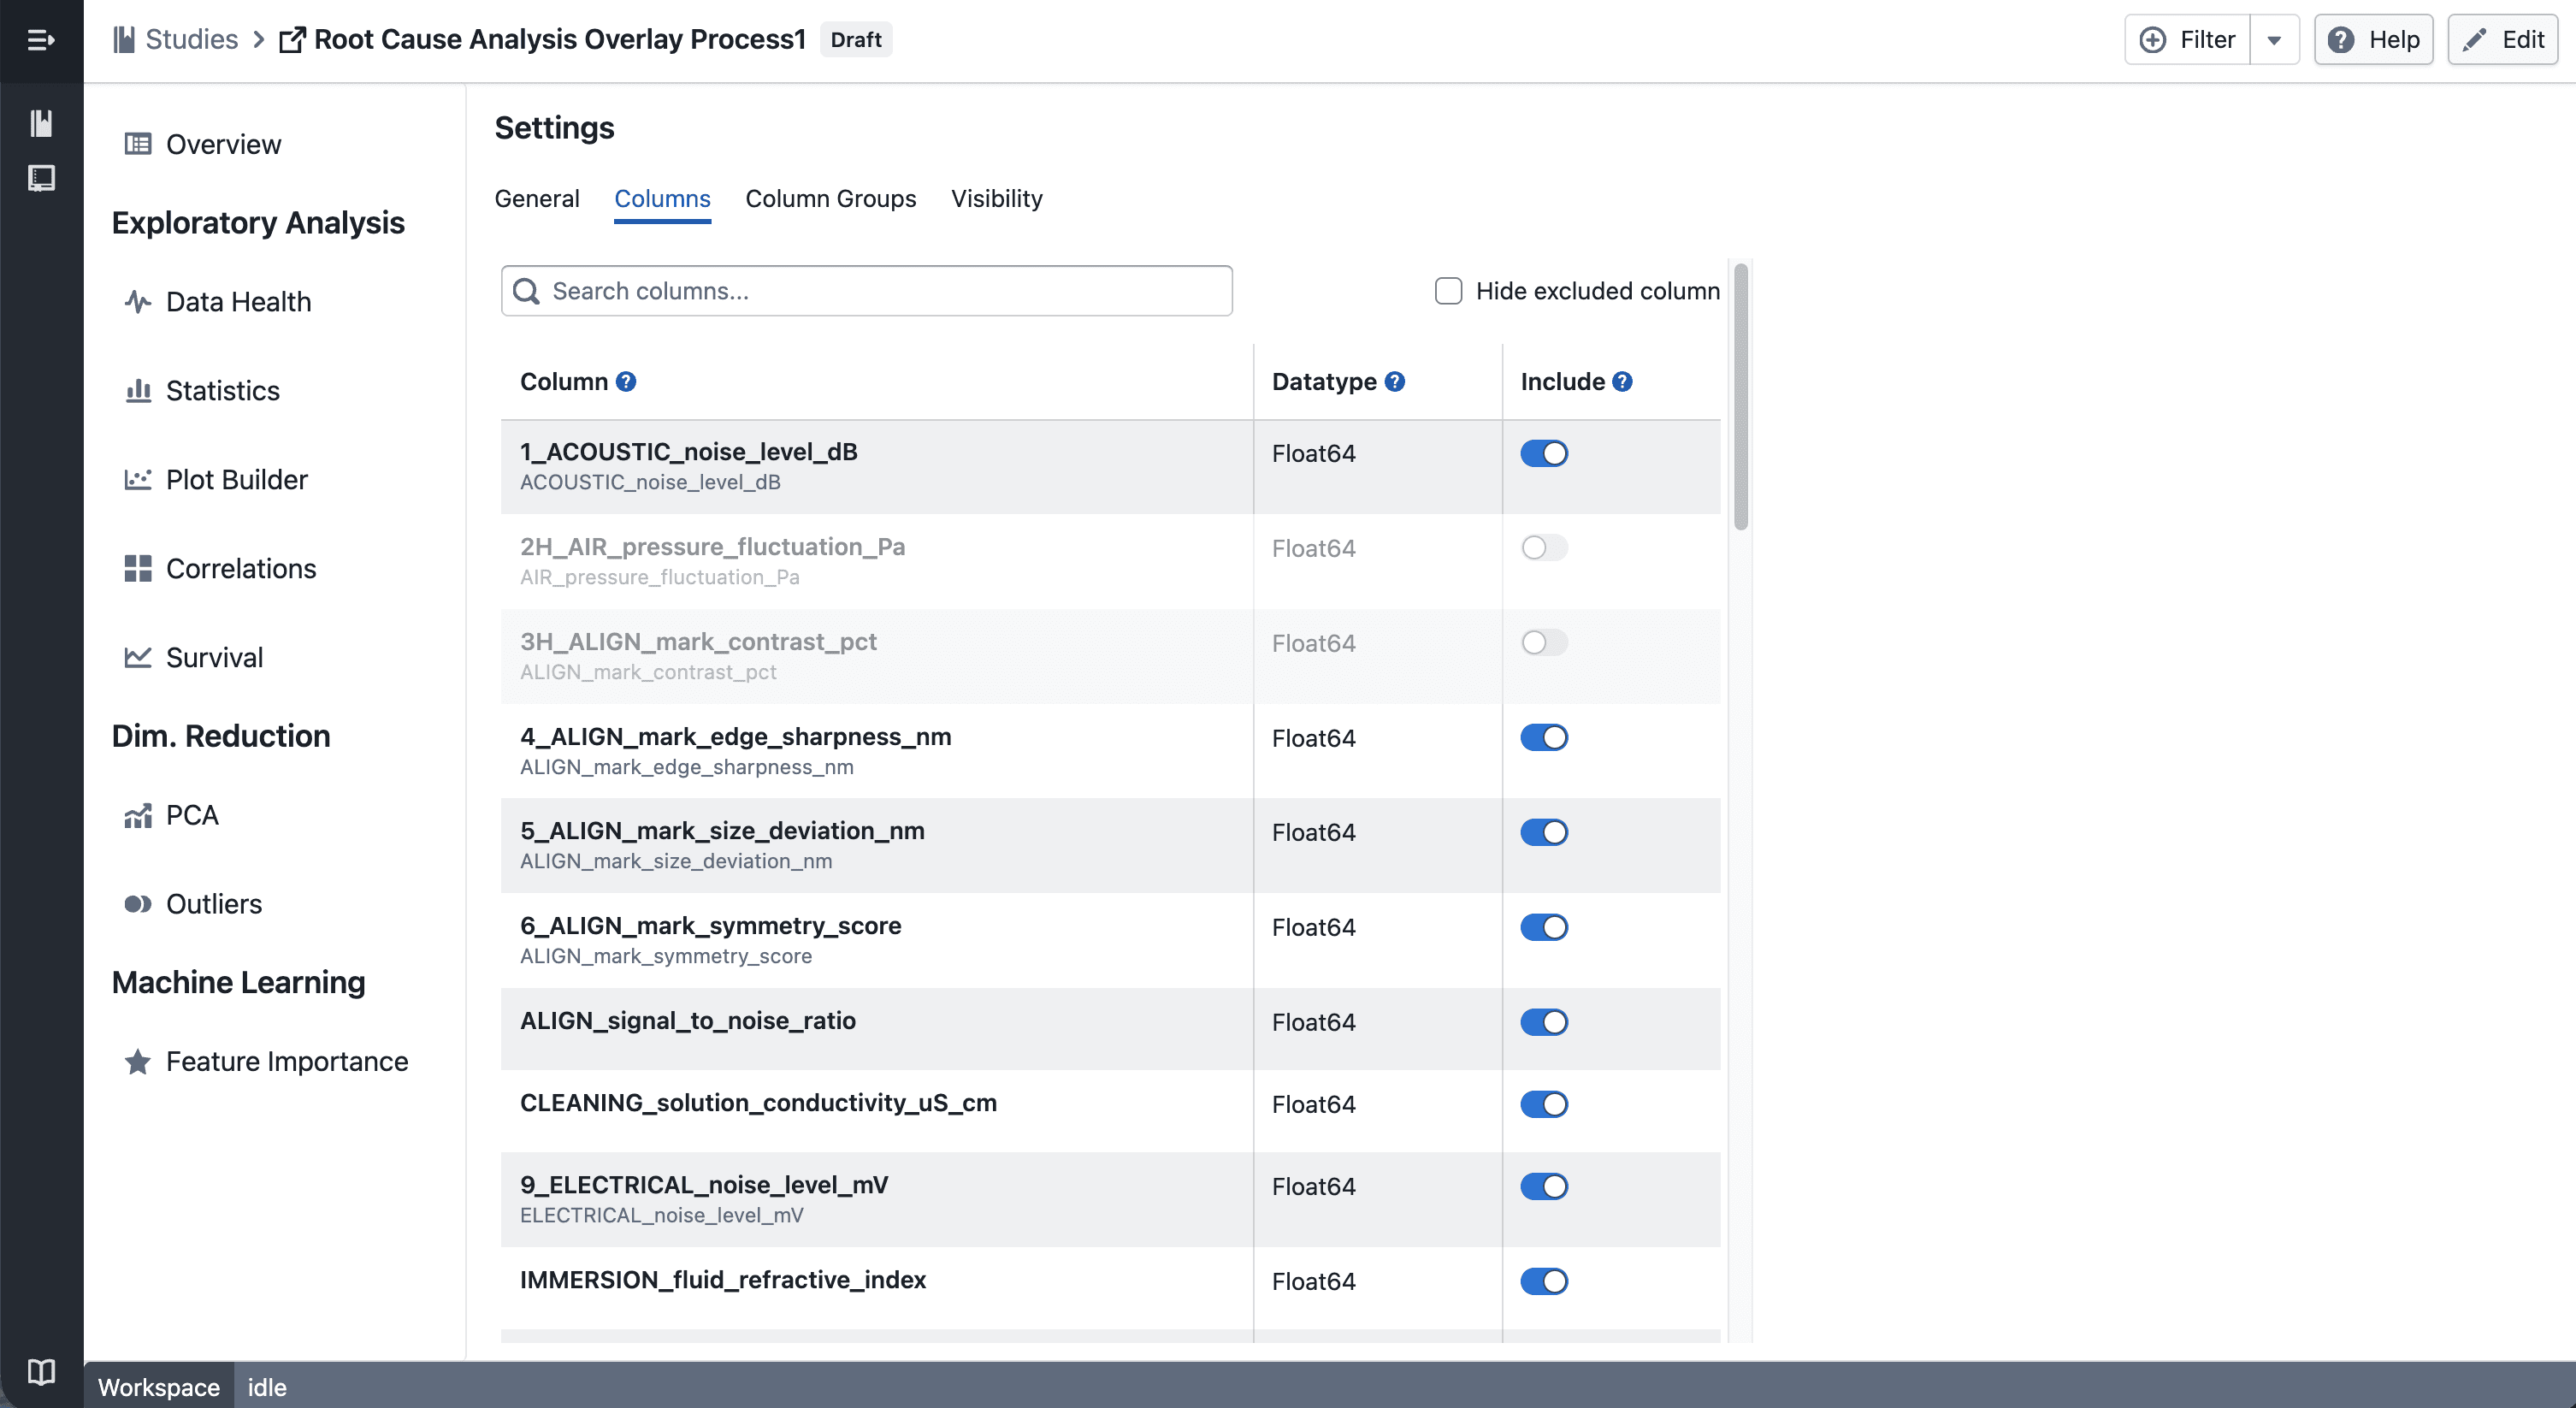
Excluded columns are now hidden by default in the Data Health summary, and both the Data Health and Column Settings pages show a consistent "Hide excluded (N)" filter.

What's included​

Standardized "Exclude" action​

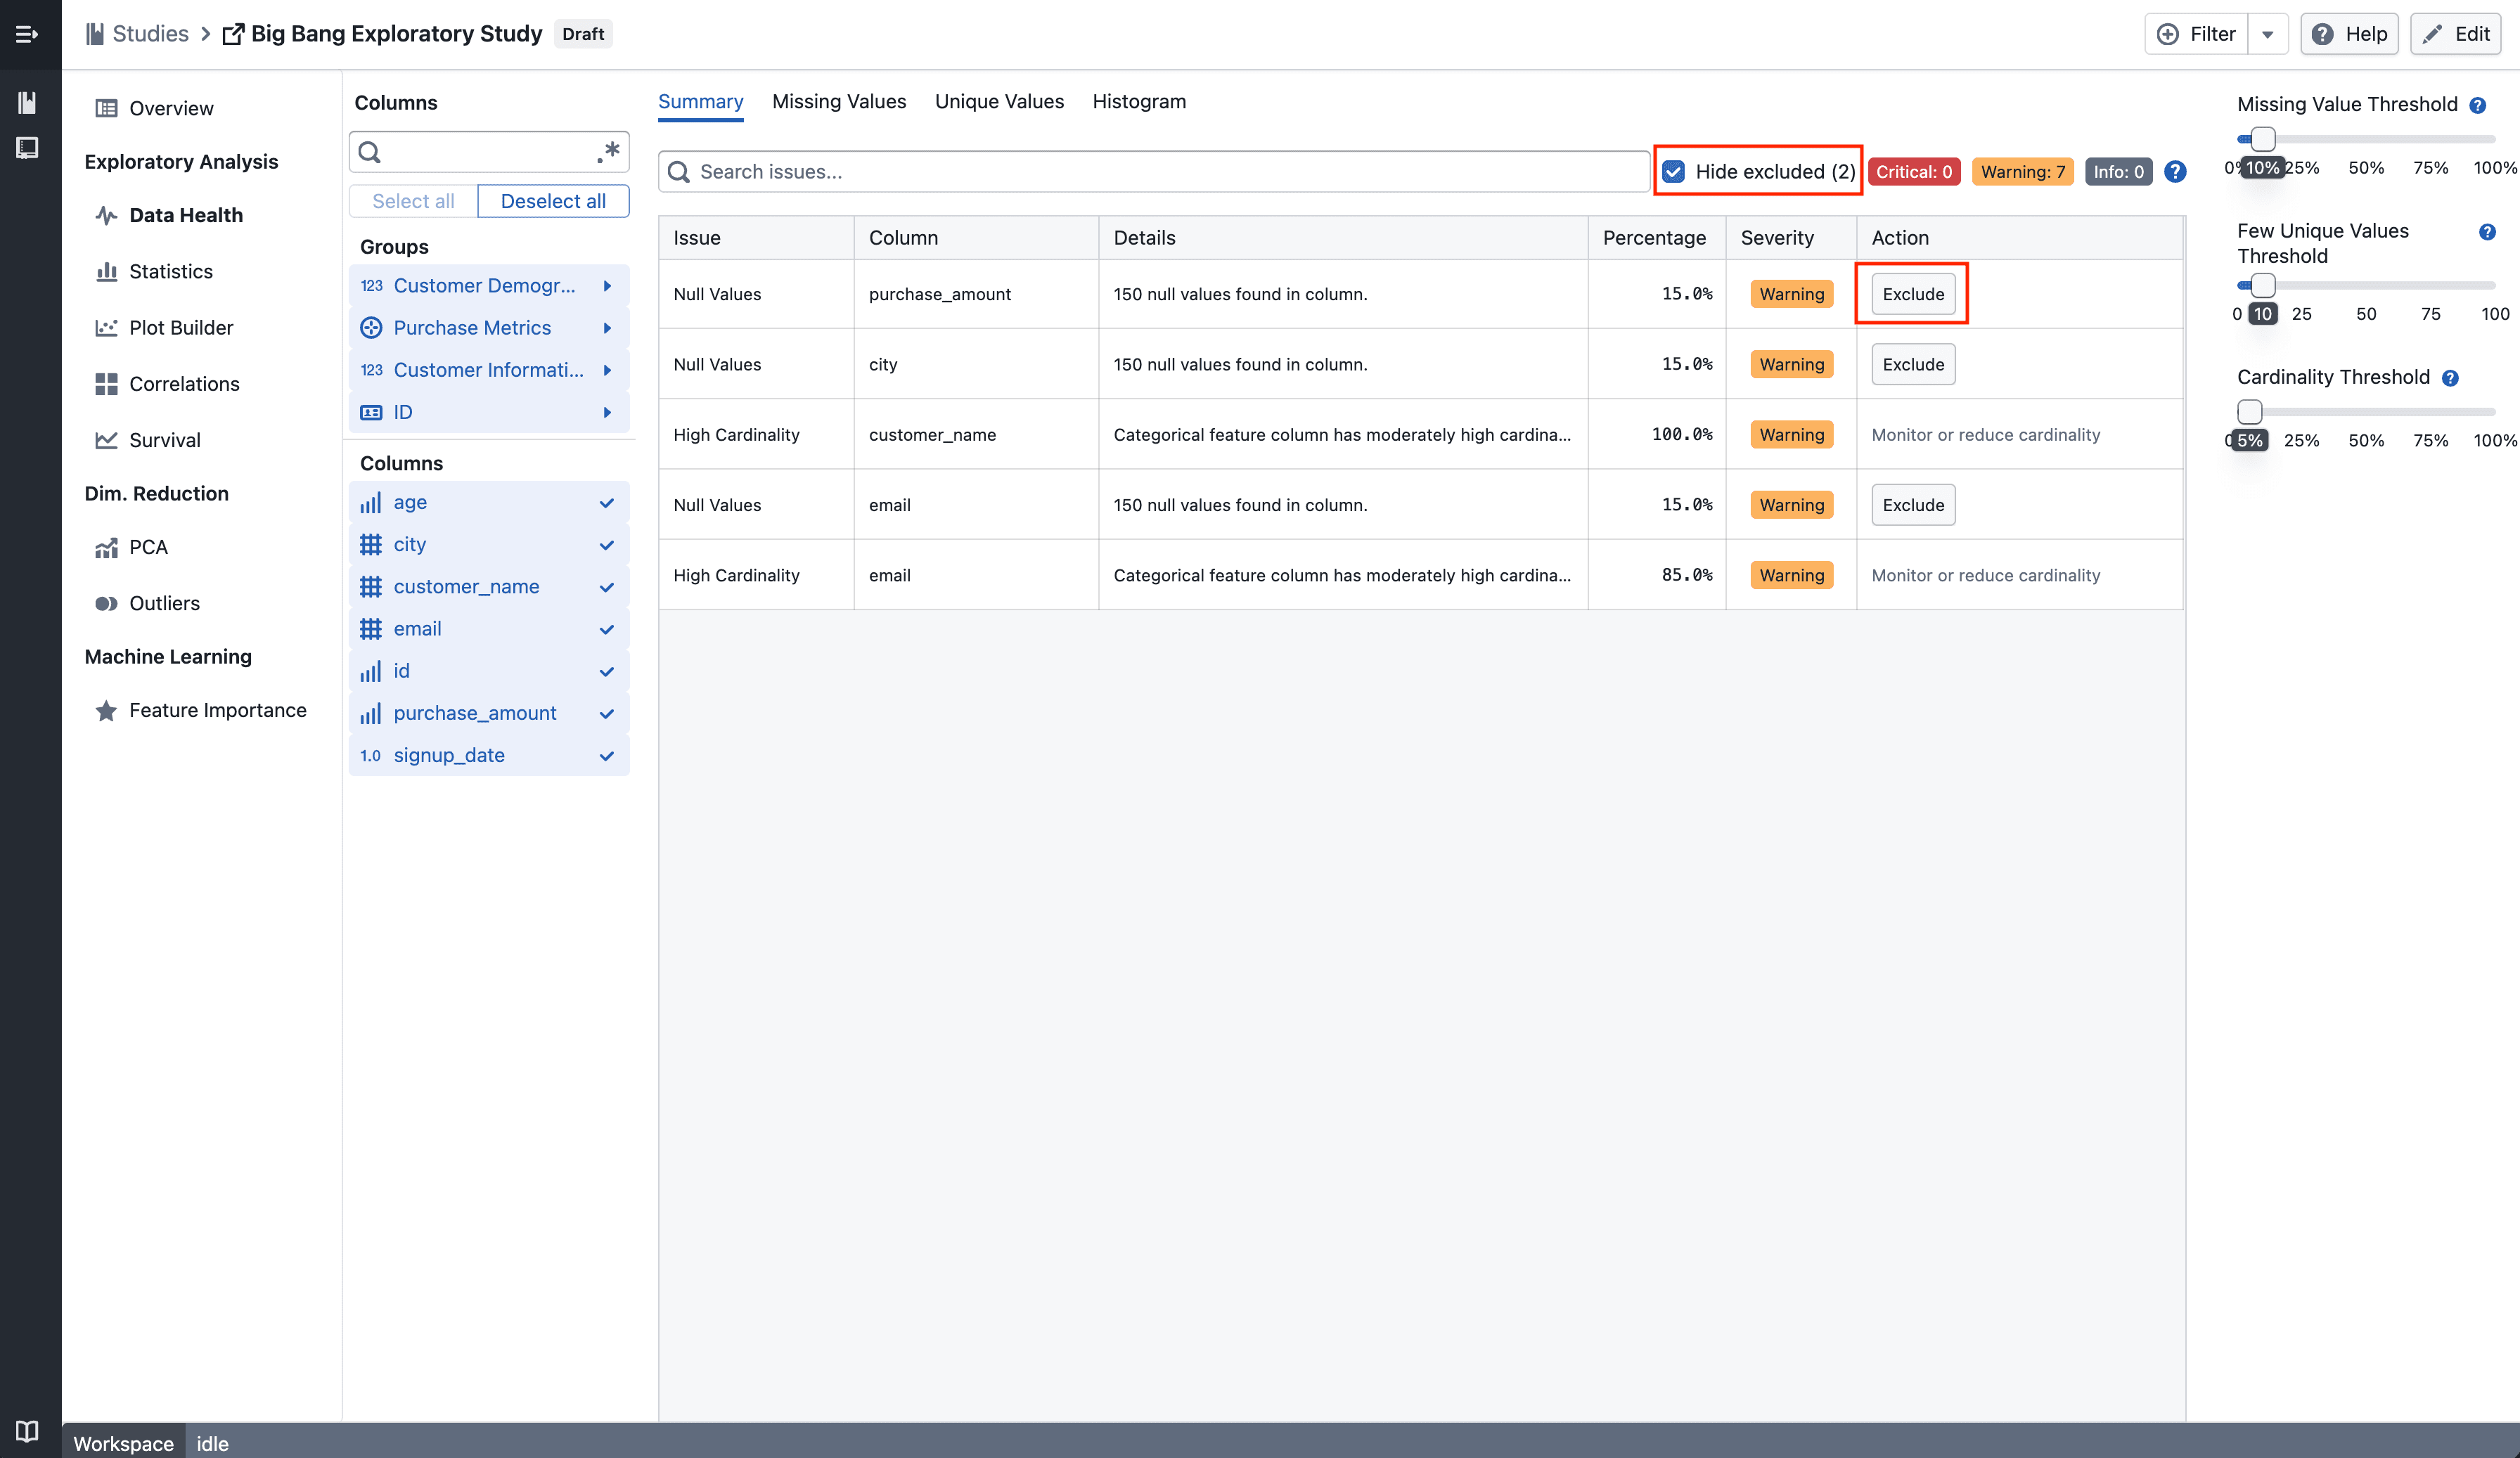
Summary

The action previously labeled Drop column in the Data Health table is now labeled Exclude, consistent with the terminology used in Column Settings. Excluded columns (visibility offs) are now hidden by default in the Data Health summary table. A Hide excluded (N) checkbox appears in the toolbar whenever there are excluded columns, allowing you to reveal them when needed.

Consistent filter in Column Settings​

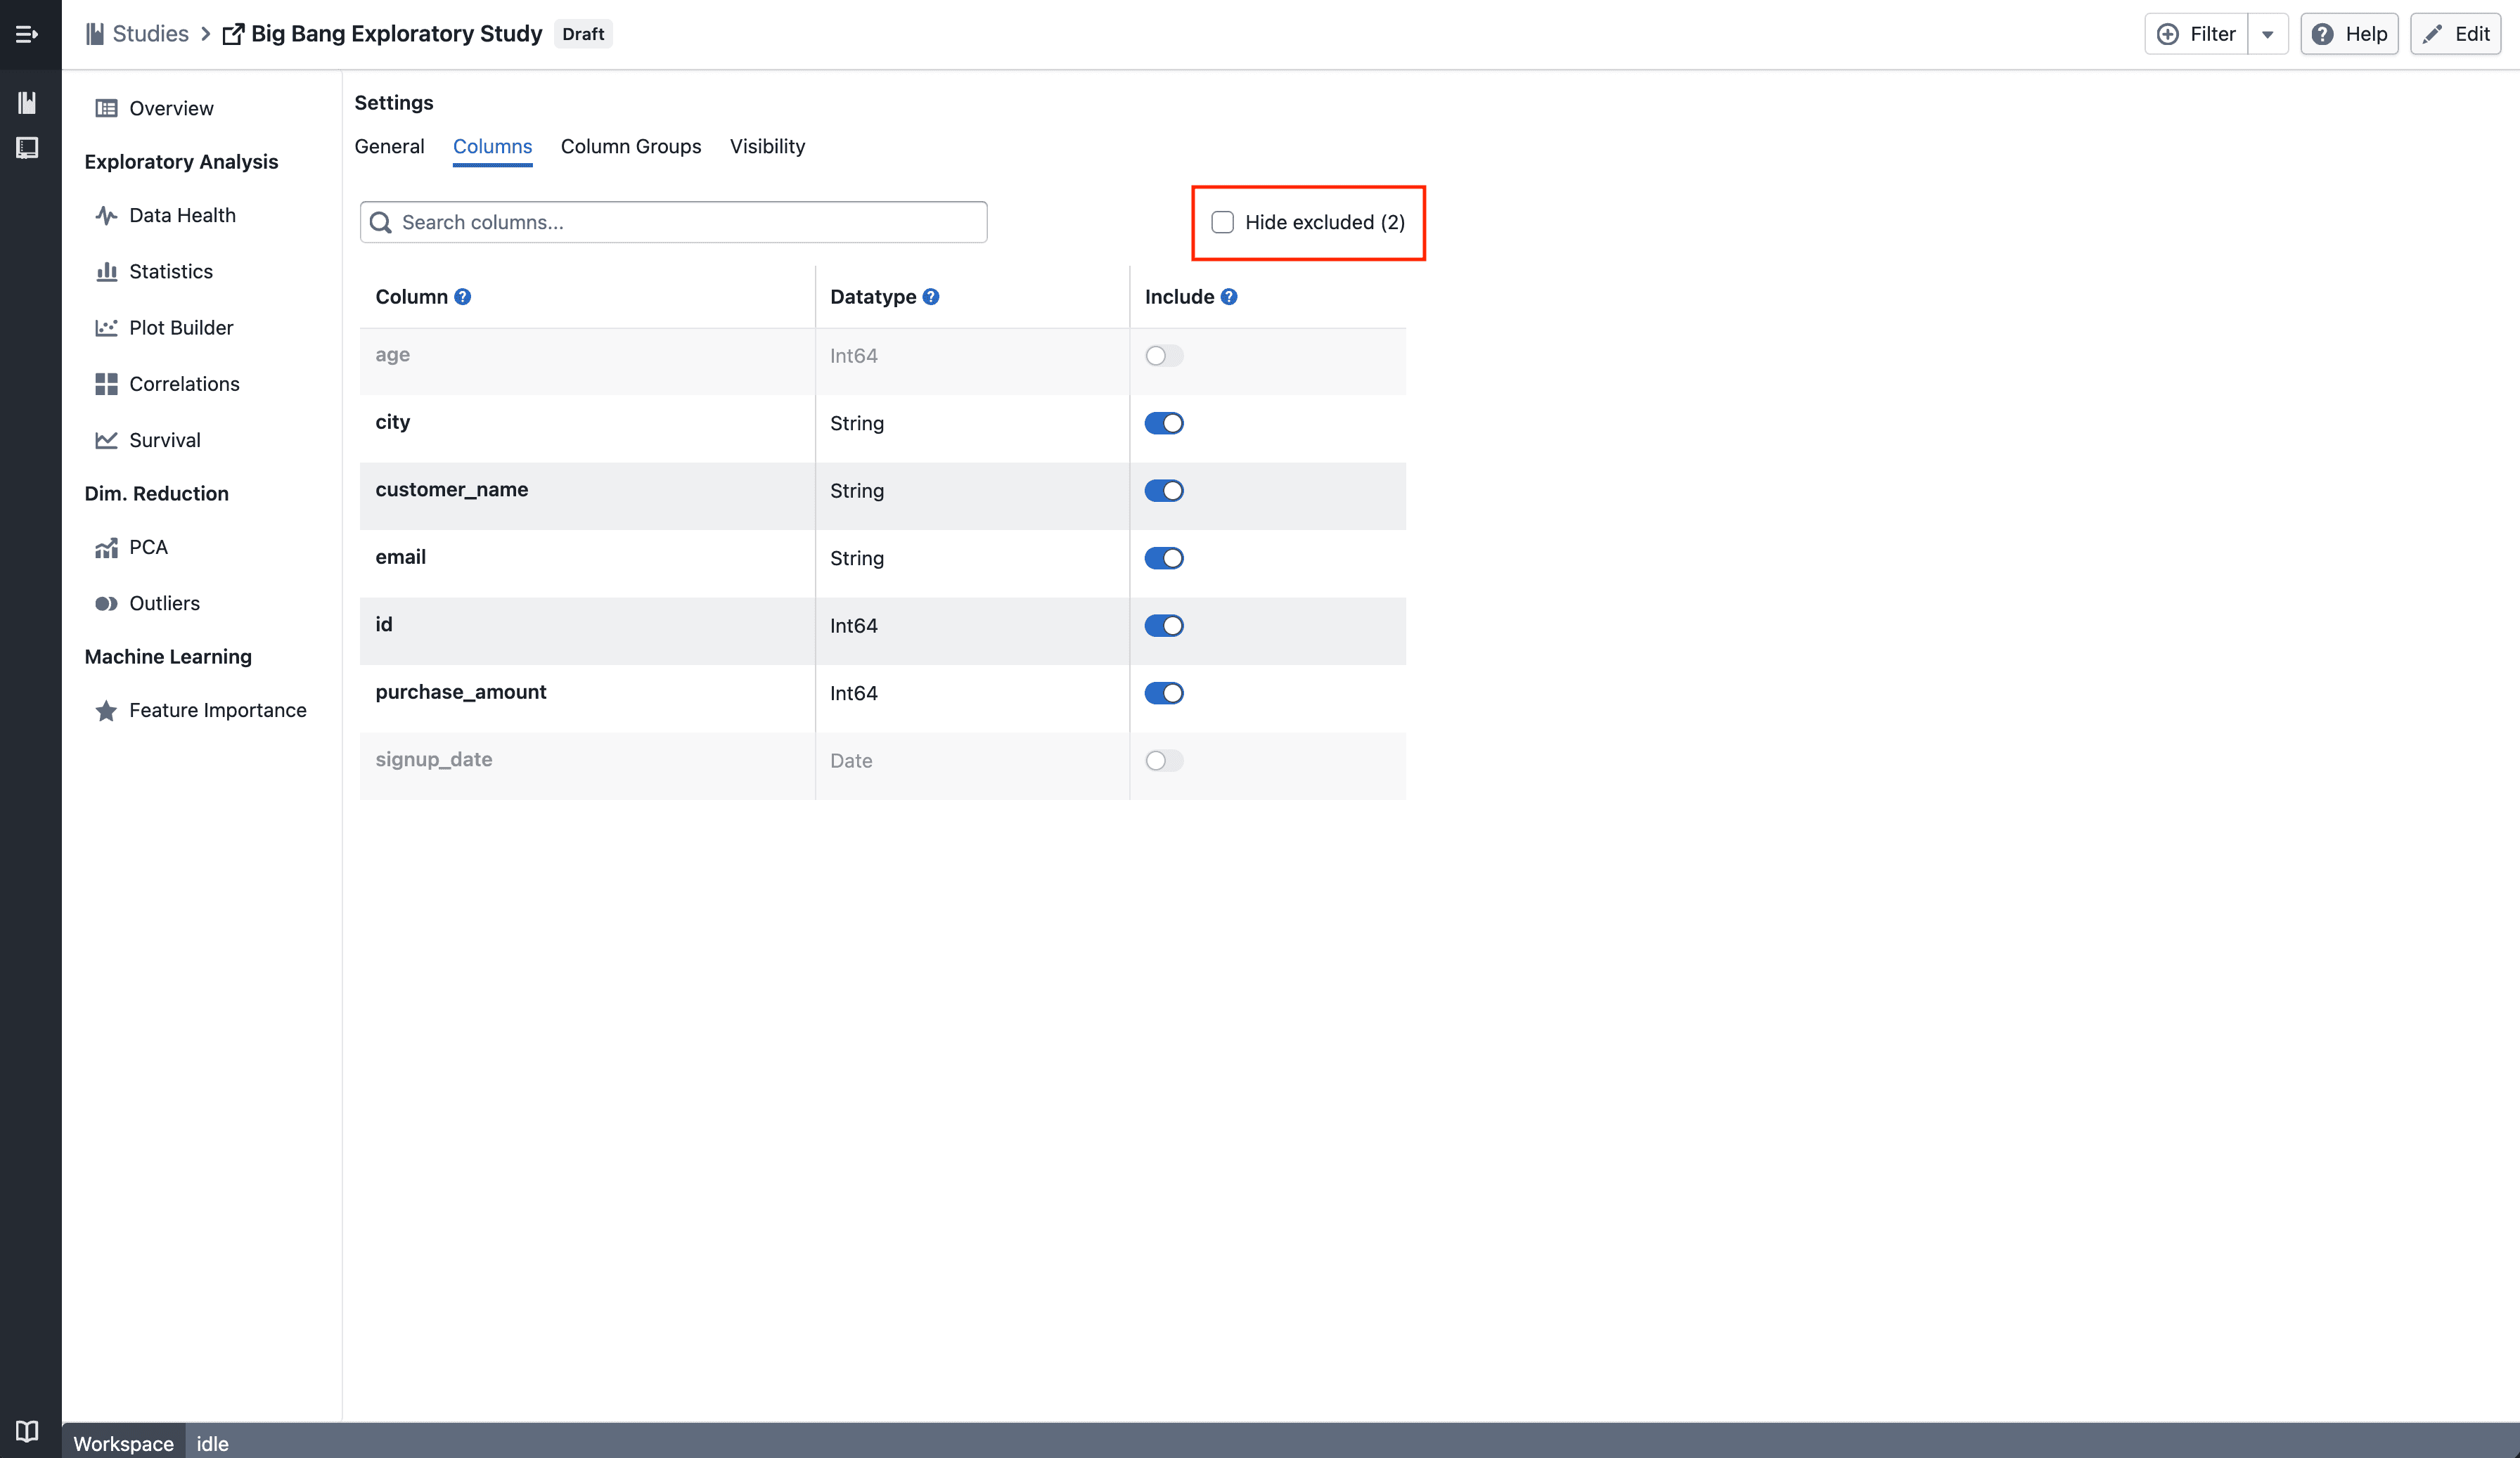
Column Edit

The same Hide excluded (N) checkbox — showing the count of excluded columns — is now displayed in the Column Settings page, matching the behaviour in Data Health.


Notes​

  • Excluded columns are hidden, not deleted — your underlying data remains unchanged
  • The count in the checkbox reflects how many columns currently have visibility turned off
  • If you notice any unexpected behavior, please share steps to reproduce

AI Summary for Plot Builder

Instantly understand any plot with an AI-generated summary — powered by an LLM with vision.

What's included​

How it works​

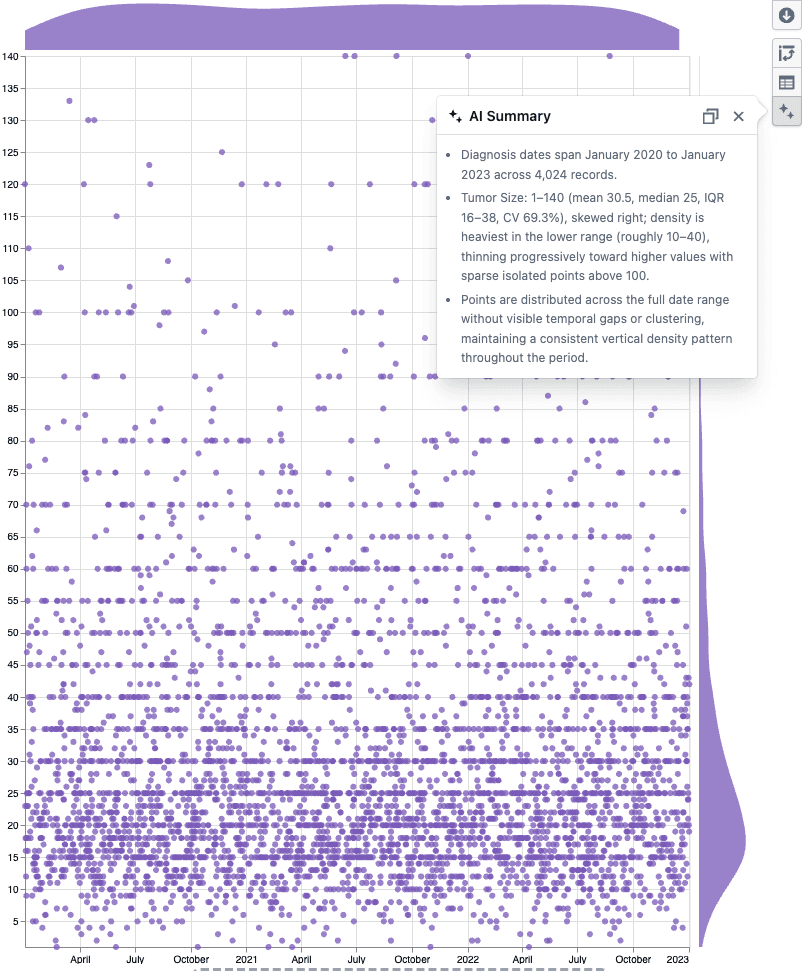
AI Summary popover on a scatter plot

  • Click the AI Summary button in the Plot Builder toolbar
  • A vision-enabled LLM reads the plot statistics and sees the chart, then returns bullet points covering distributions, group breakdowns, data quality issues, and visual patterns like clusters or outliers
  • Hit copy to paste the summary into a report or analysis note

Notes​

  • Works with scatter plots, box plots, and heatmaps
  • The summary is factual only — the LLM does not assess or make recommendations
  • If you notice any unexpected behavior, please share steps to reproduce

Column Management

Rename and include or exclude columns across your study from Column Management.

What's included​

Column Management​

Column Management

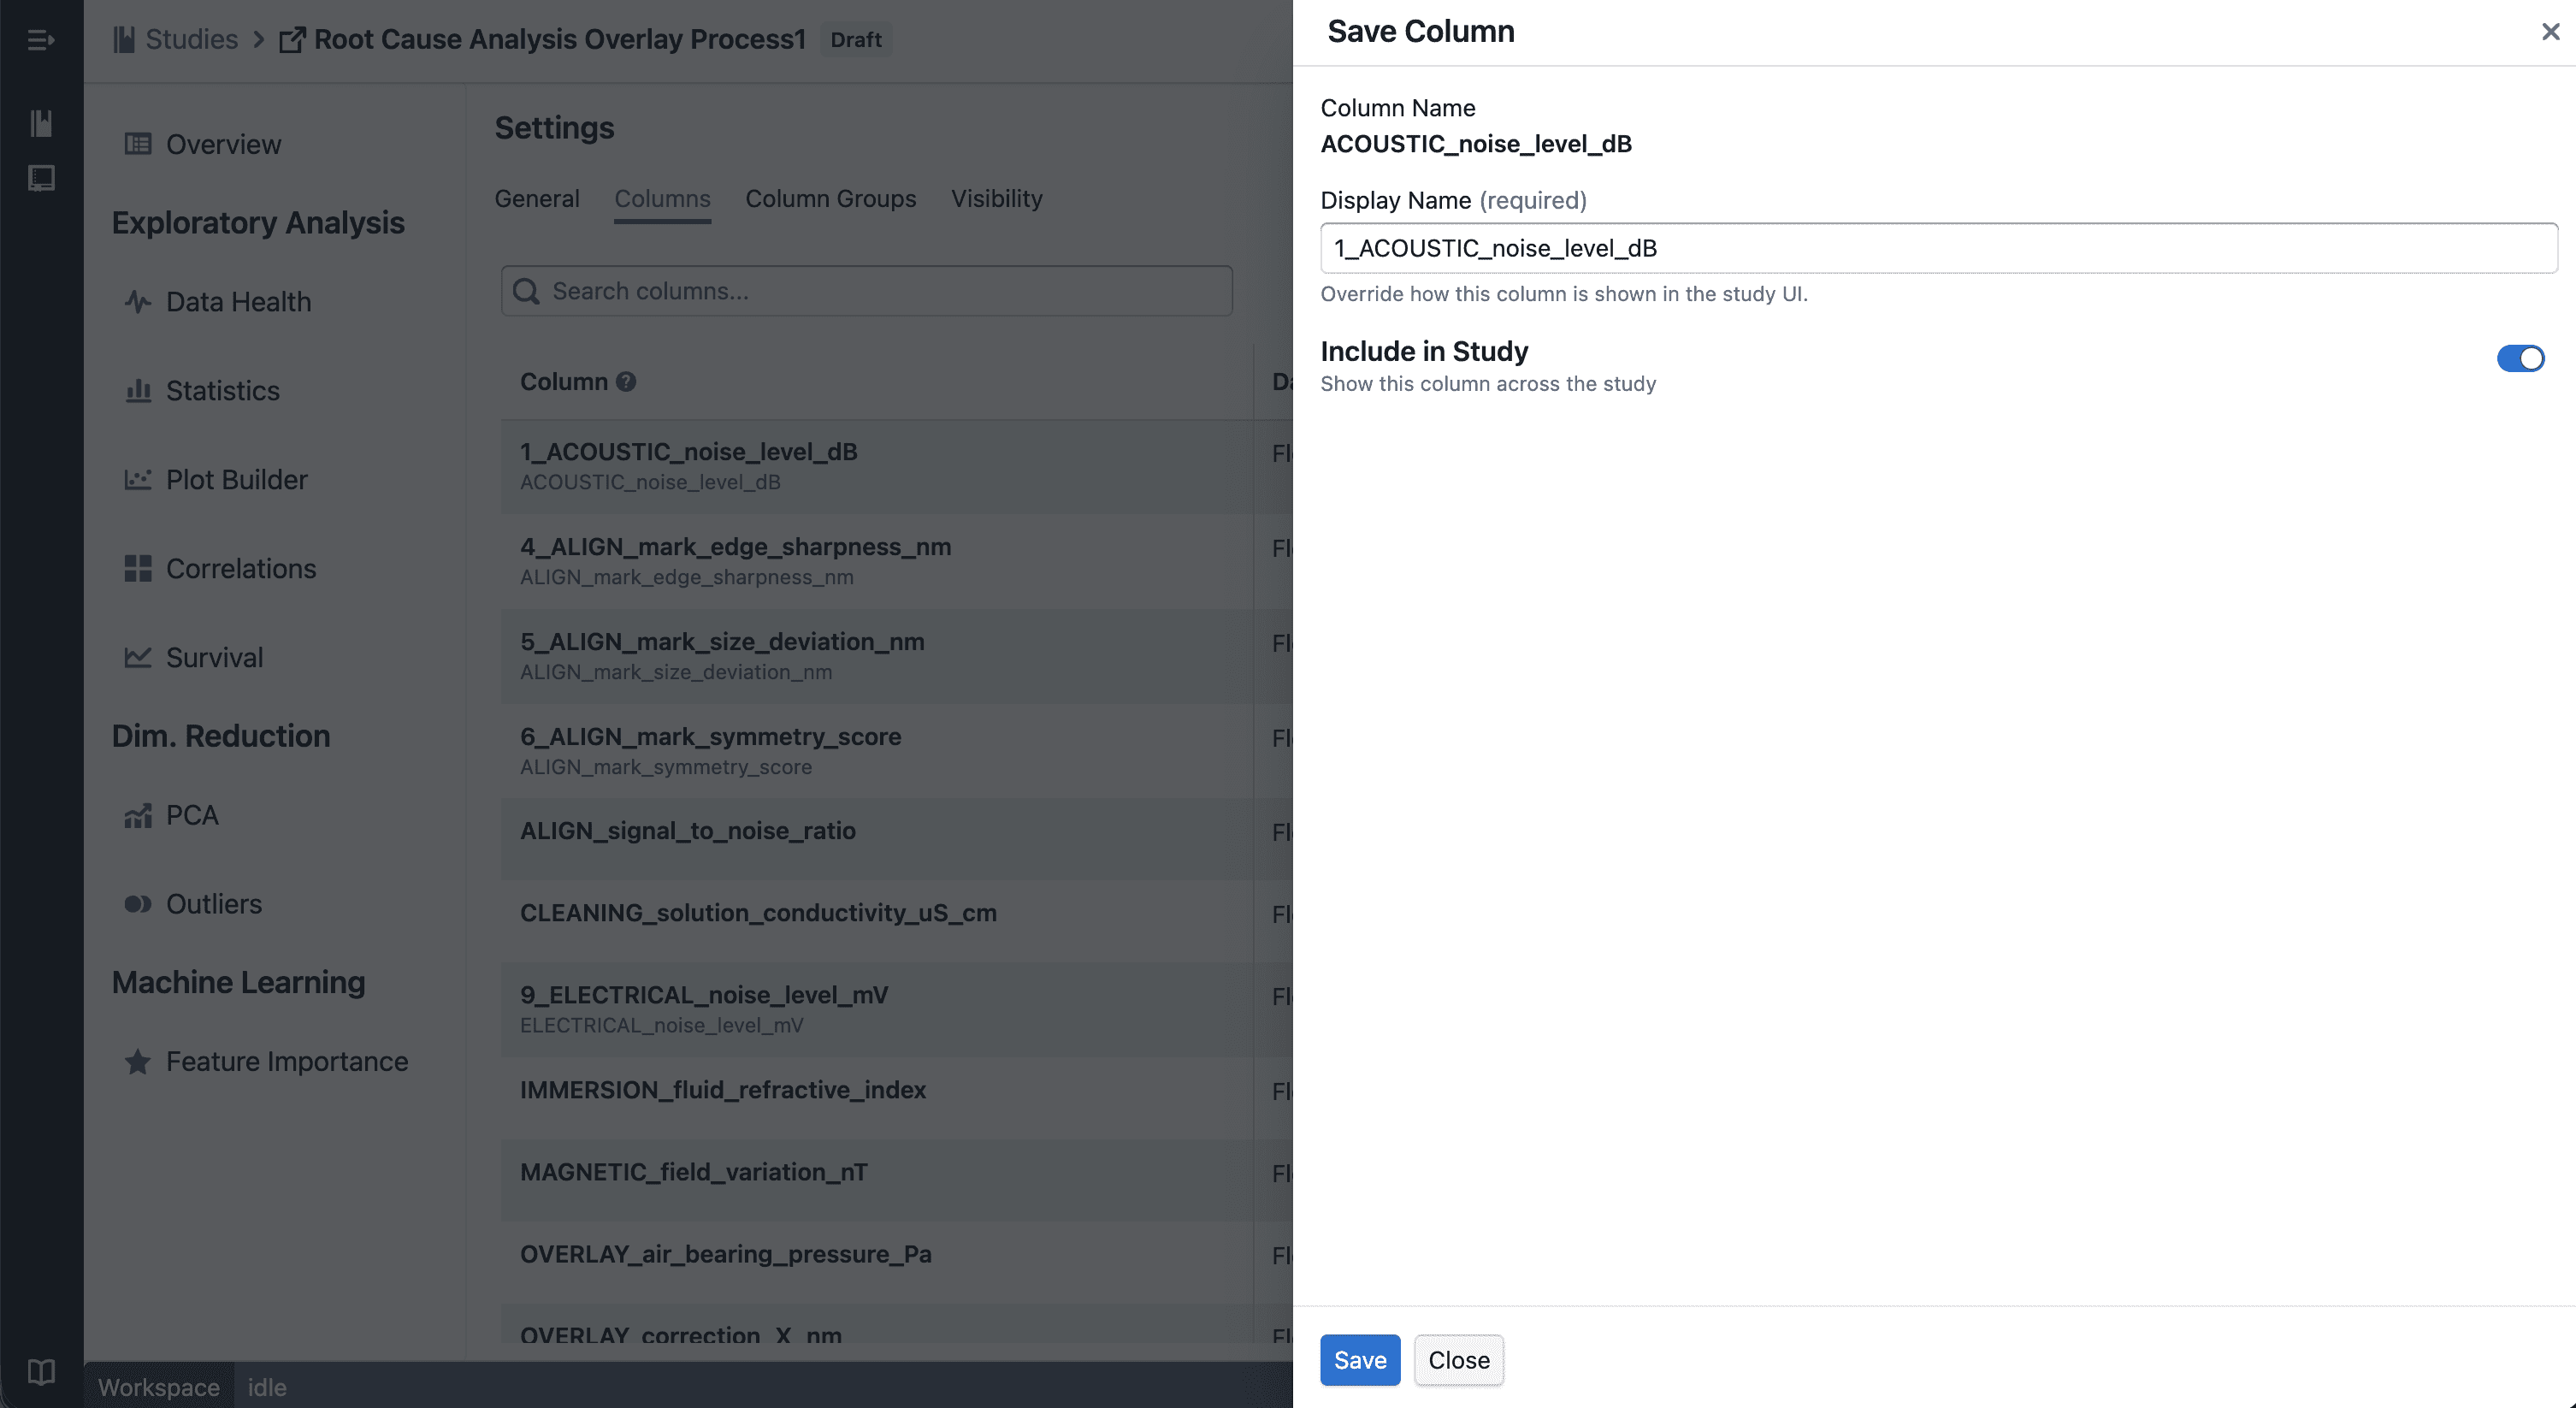
You can now manage columns from Edit → Columns.

  • Exclude columns to remove them from all views in the study — including plots, statistics, and column groups
  • Include columns again at any time to restore them across the study

Update Column​

Drawer to update

  • Rename columns to use more meaningful display names across your study
  • Changes are applied consistently across all views

Notes​

  • Excluded columns are hidden, not deleted — your underlying data remains unchanged
  • Renaming affects display only and does not modify raw data
  • If you notice any unexpected behavior, please share steps to reproduce

Desirability Convergence Chart

New desirability convergence chart for tracking optimization progress across experiment trials.

What's included​

How it works​

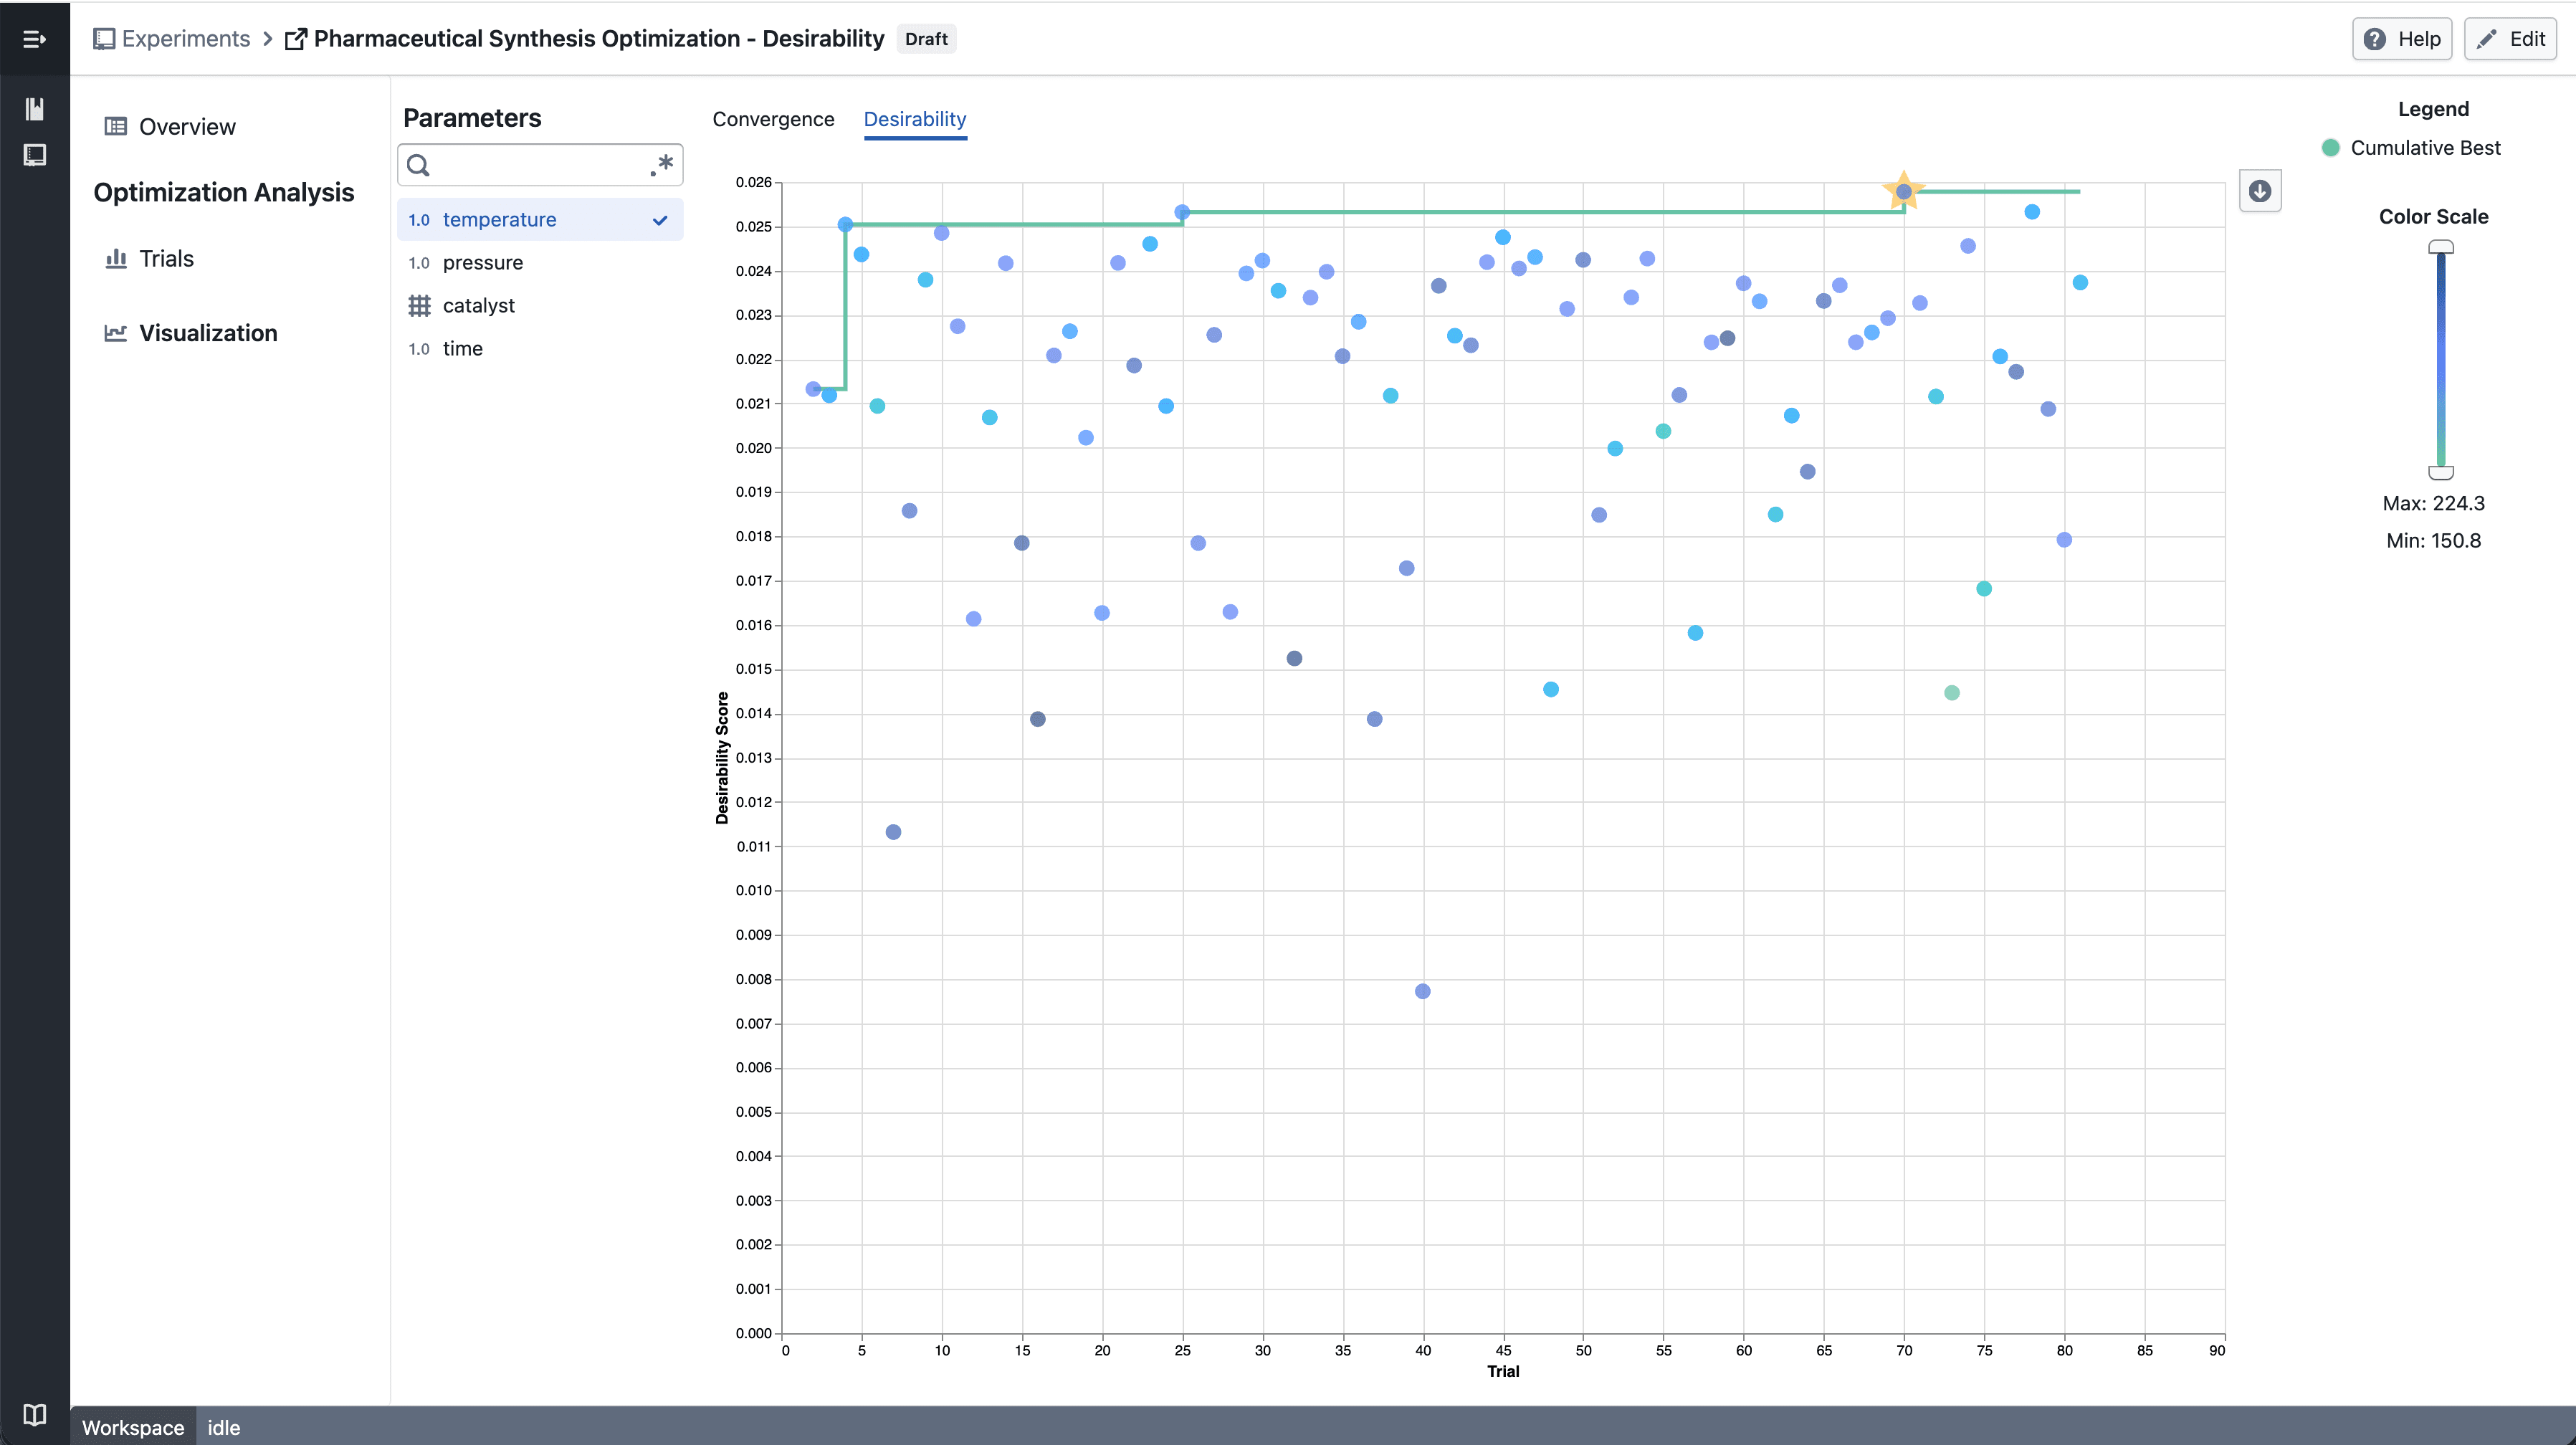
Numerical Parameter - select parameter

  • Select a numerical parameter from the parameter sidebar to color data points by that parameter's value
  • A continuous color scale shows how parameter values relate to desirability scores across trials
  • The best so far line tracks the highest desirability achieved up to each trial

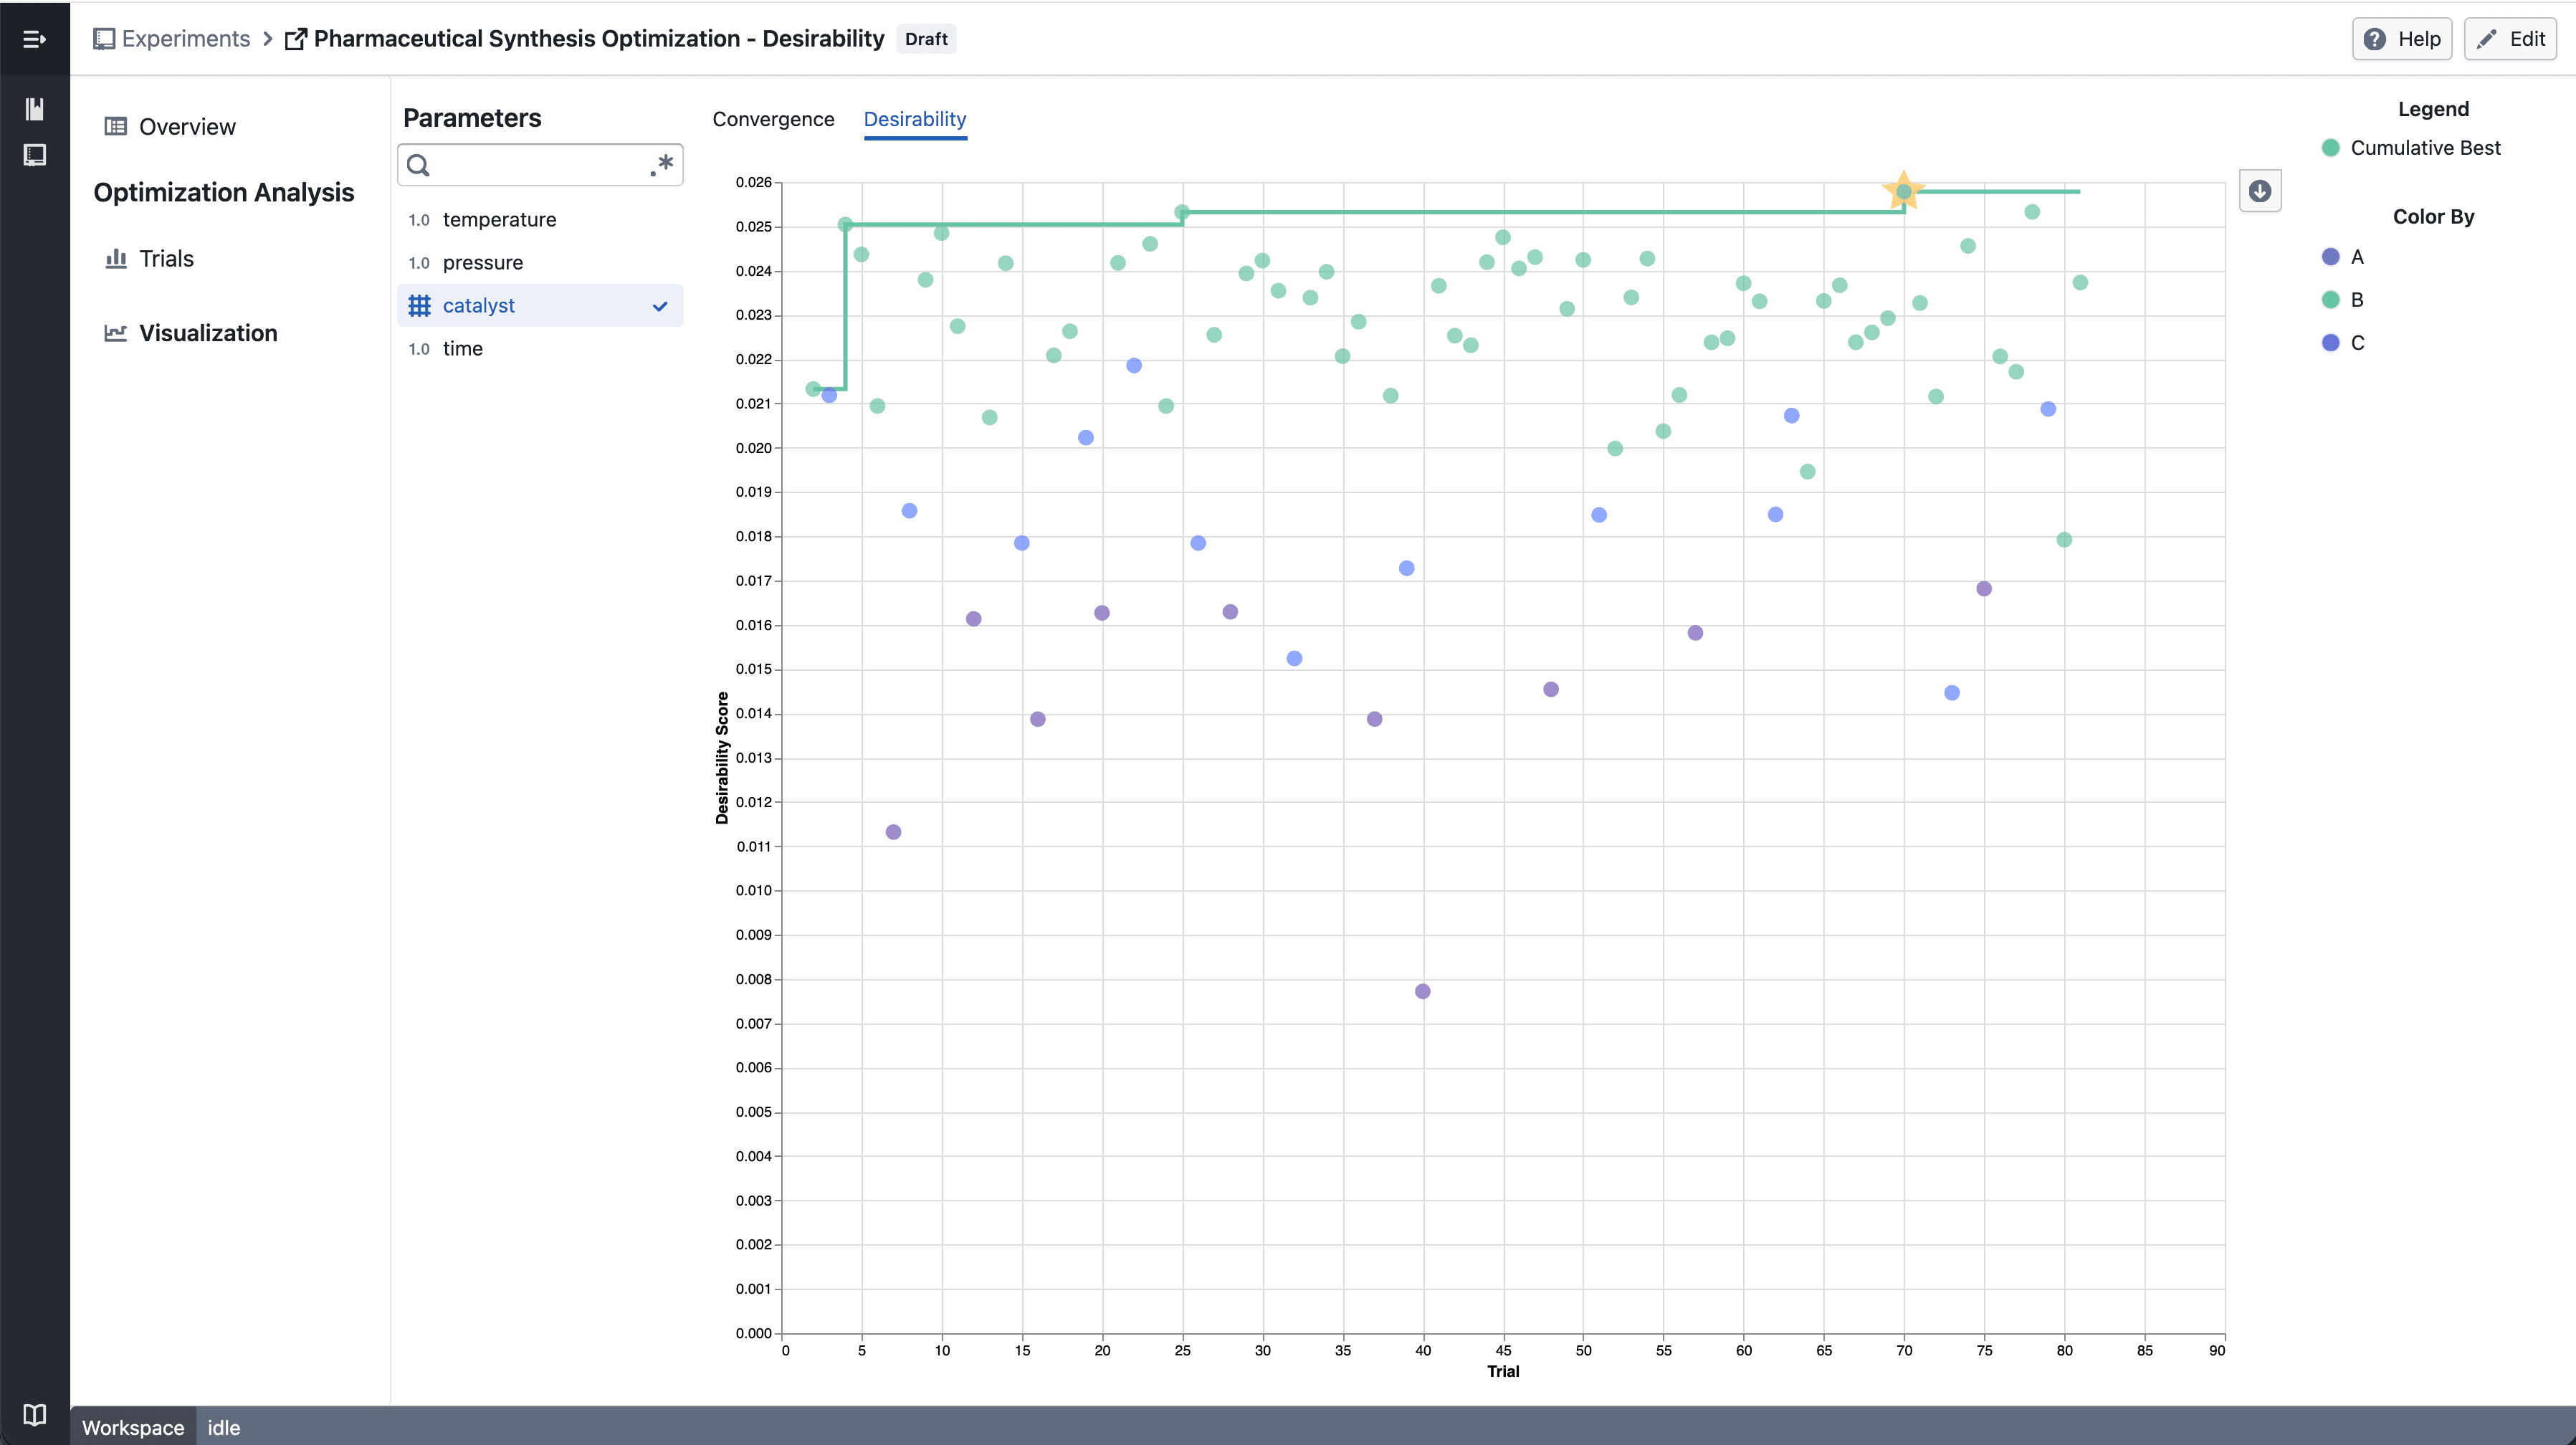
Categorical Parameter - select parameter

  • Select a categorical parameter to color data points by category
  • A discrete color legend identifies each category value

Notes​

  • The convergence chart is available under the Desirability tab in the Visualization section
  • Chart interactions and layout may continue to evolve during the beta phase
  • If you notice any unexpected behavior, please share steps to reproduce

Trellis plots in Experiment Visualization Convergence

Split convergence plot into a multi-panel grid when multiple targets are selected.

What's included​

How it works​

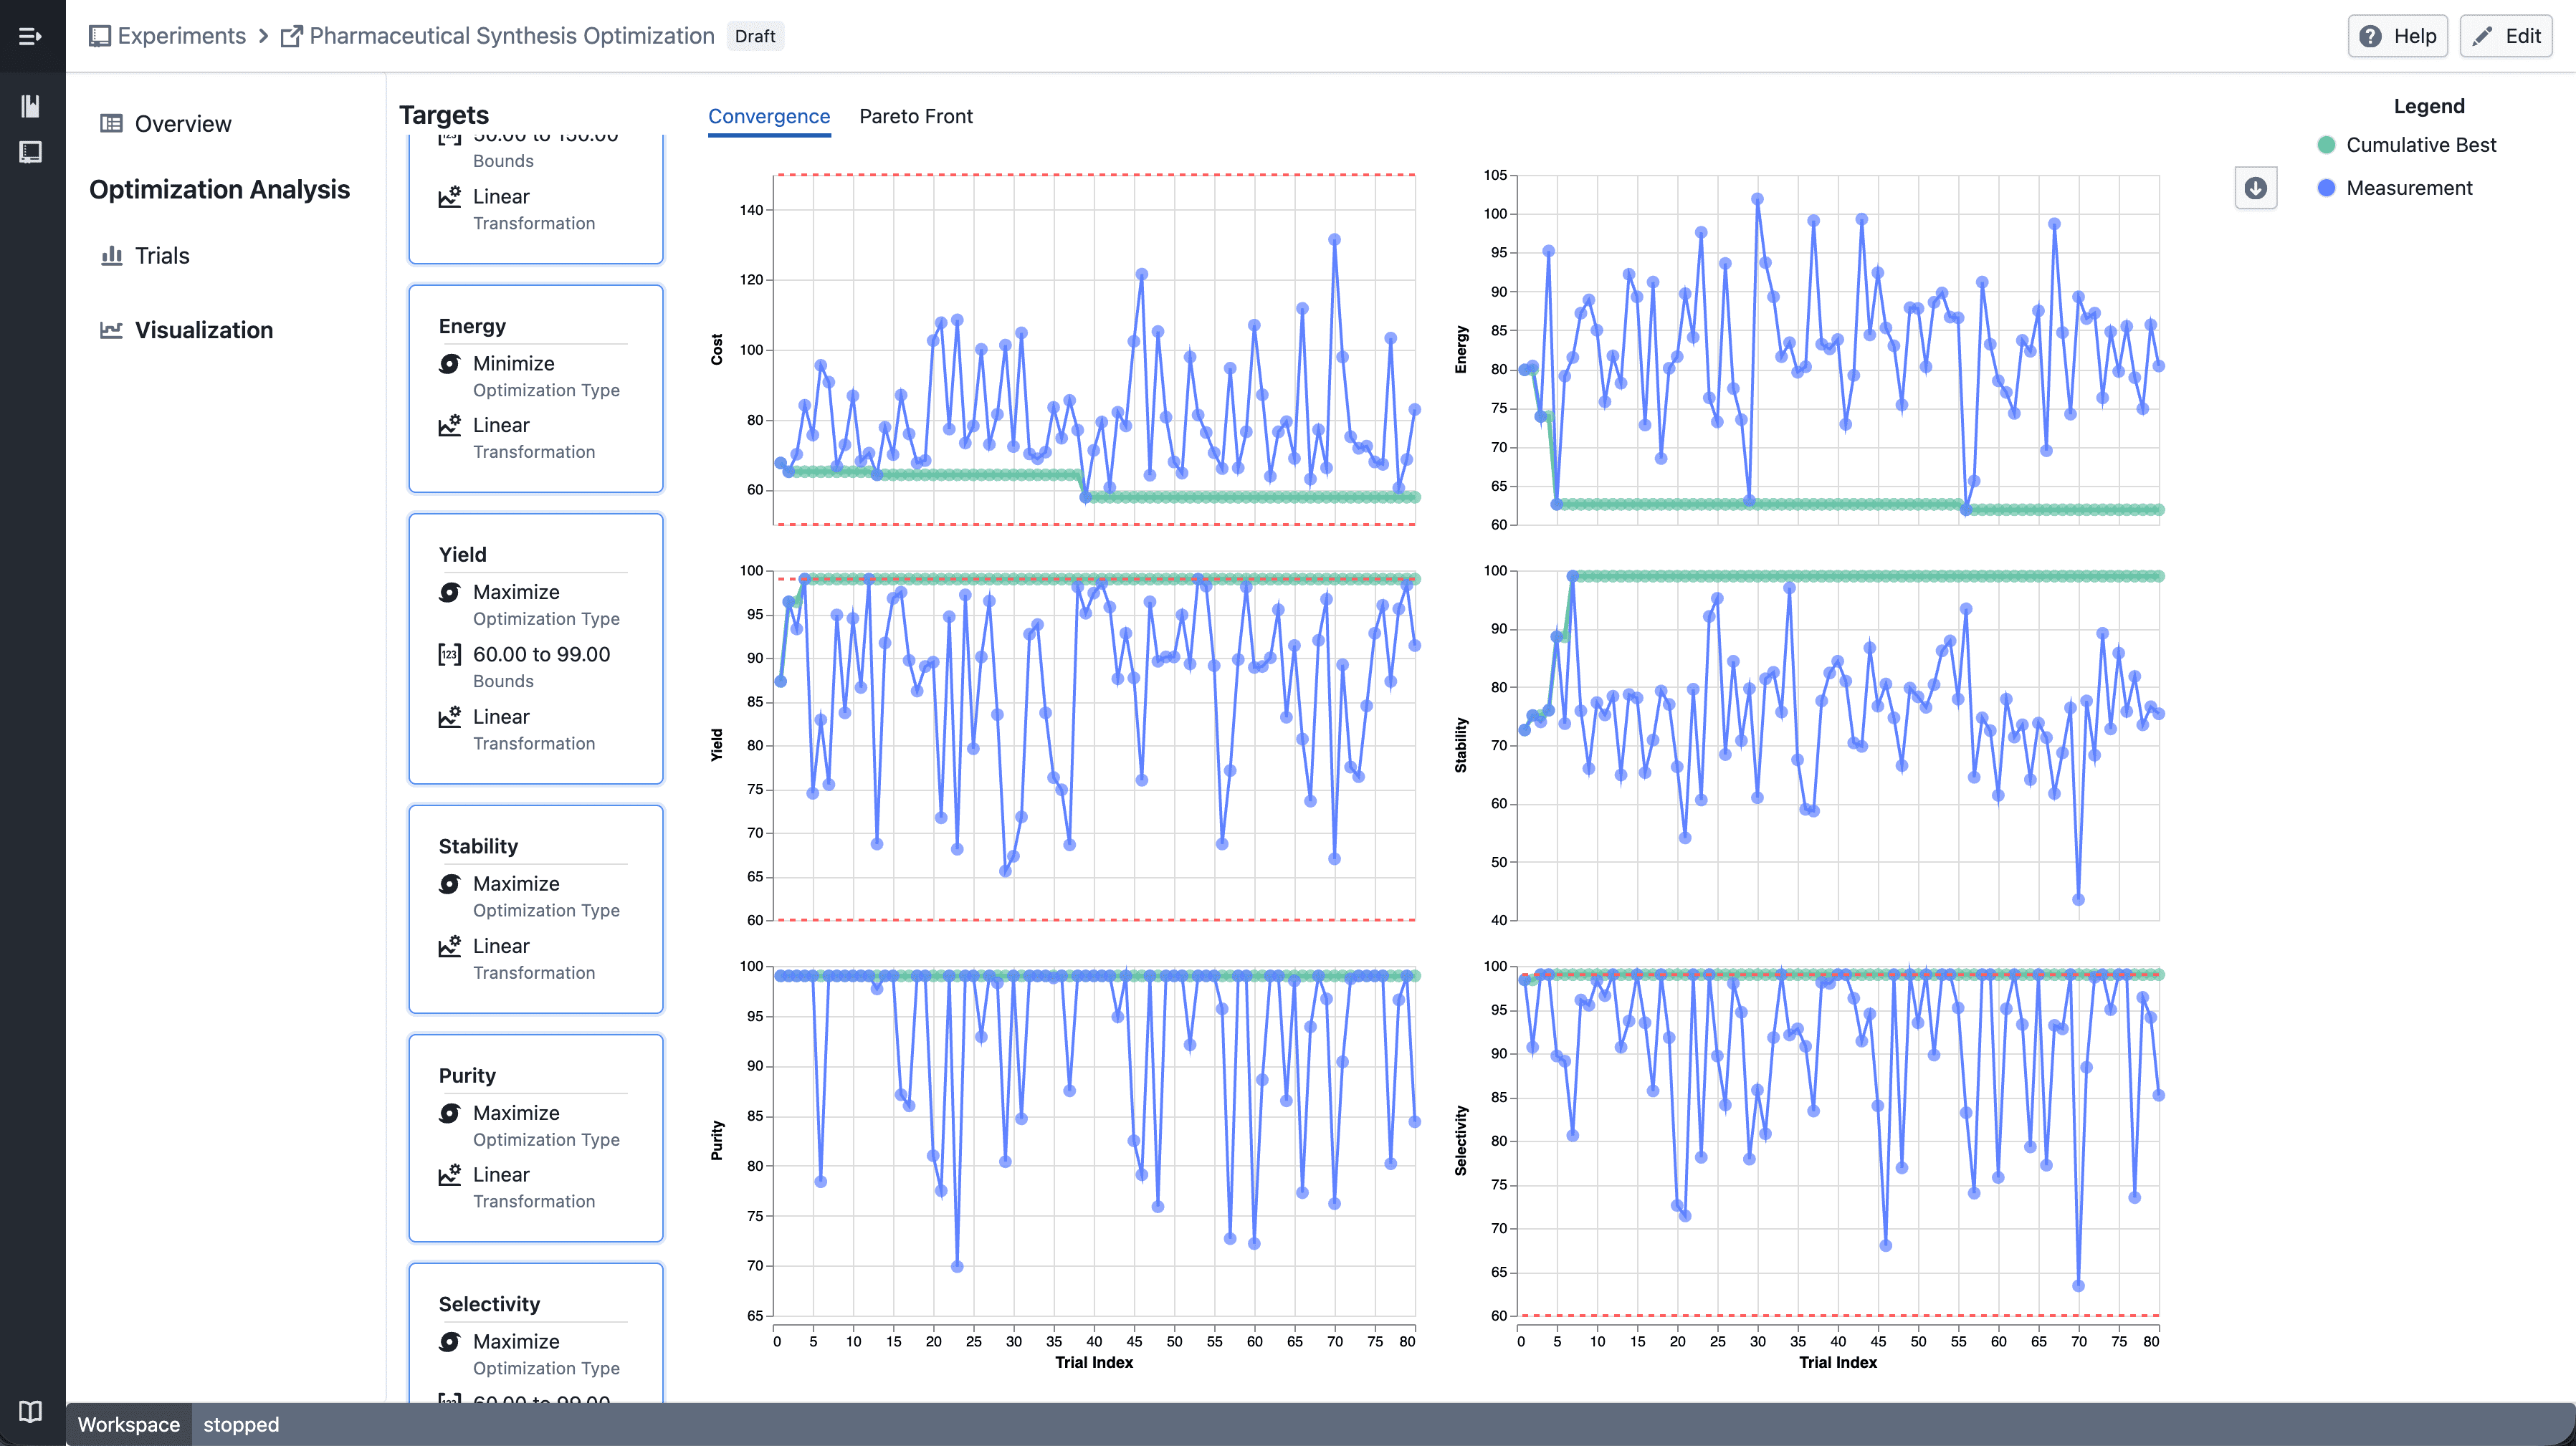
Trellis convergence plot

  • Select multiple targets from the target sidebar
  • The convergence plot automatically splits into a grid — one panel per target
  • Each panel shares the same x-axis (iteration index) but has an independent y-axis scale

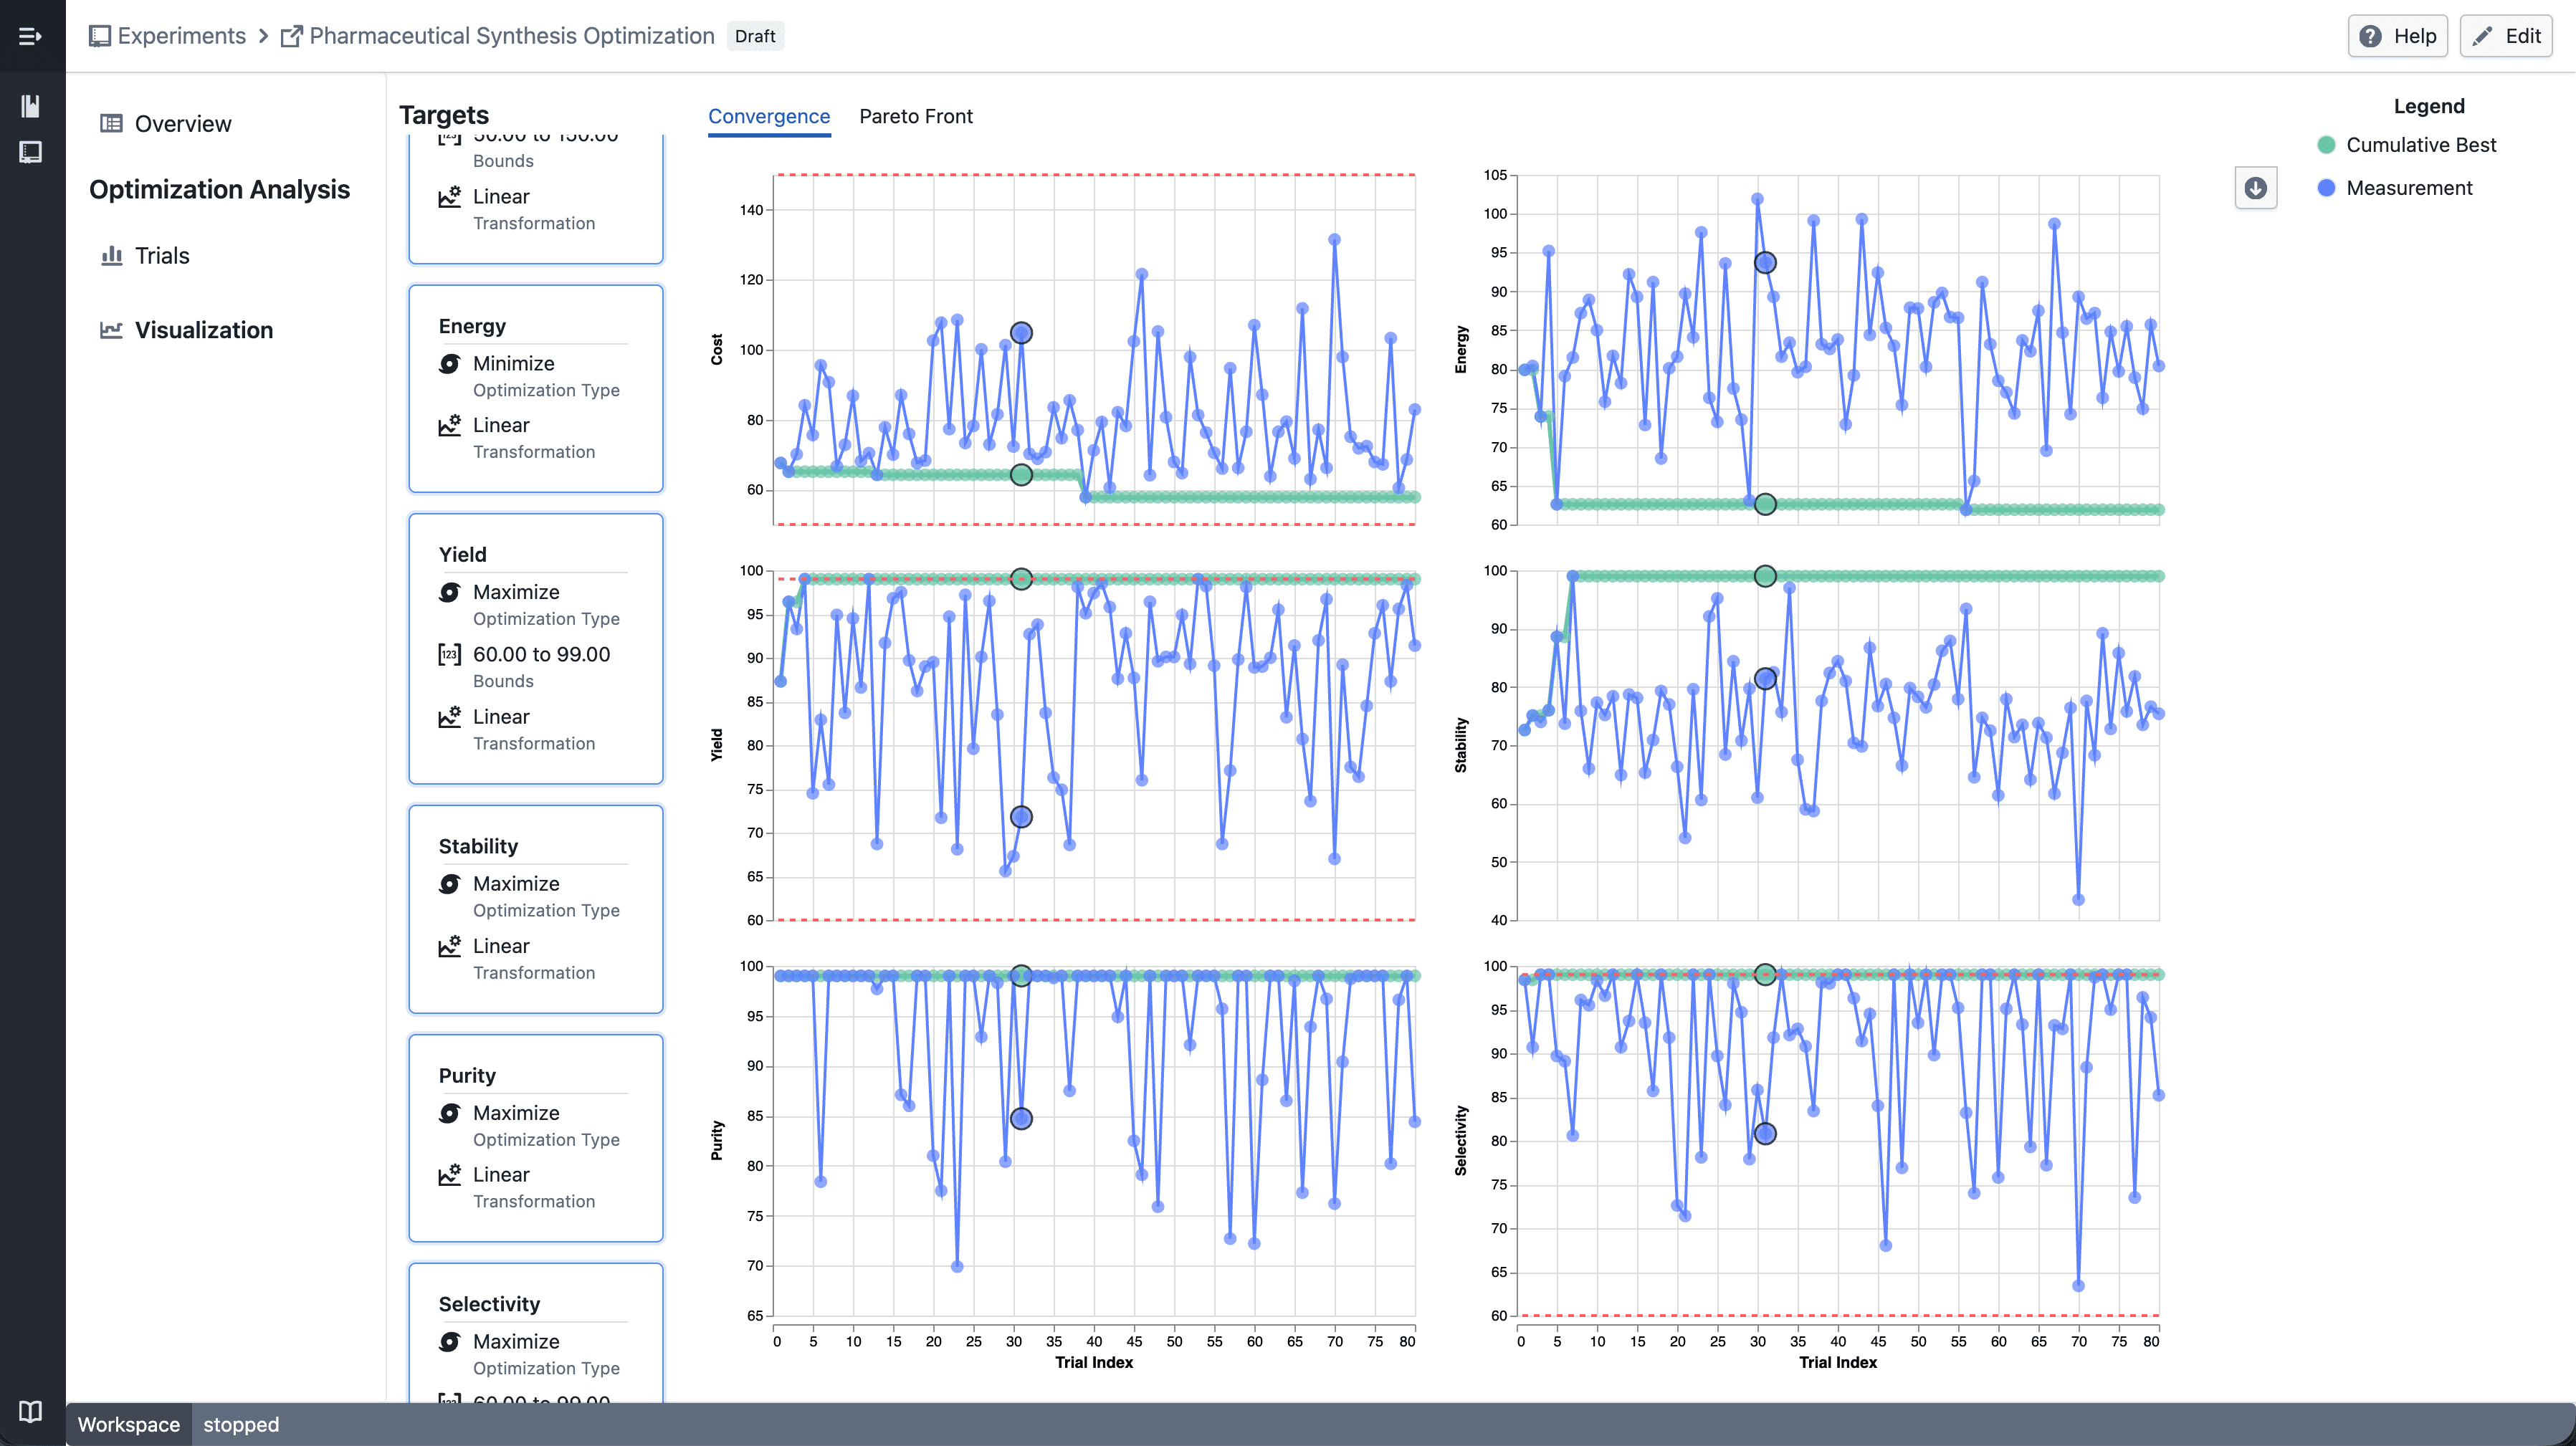
Trellis - select point

  • Click a data point to highlight the corresponding trial across all panels

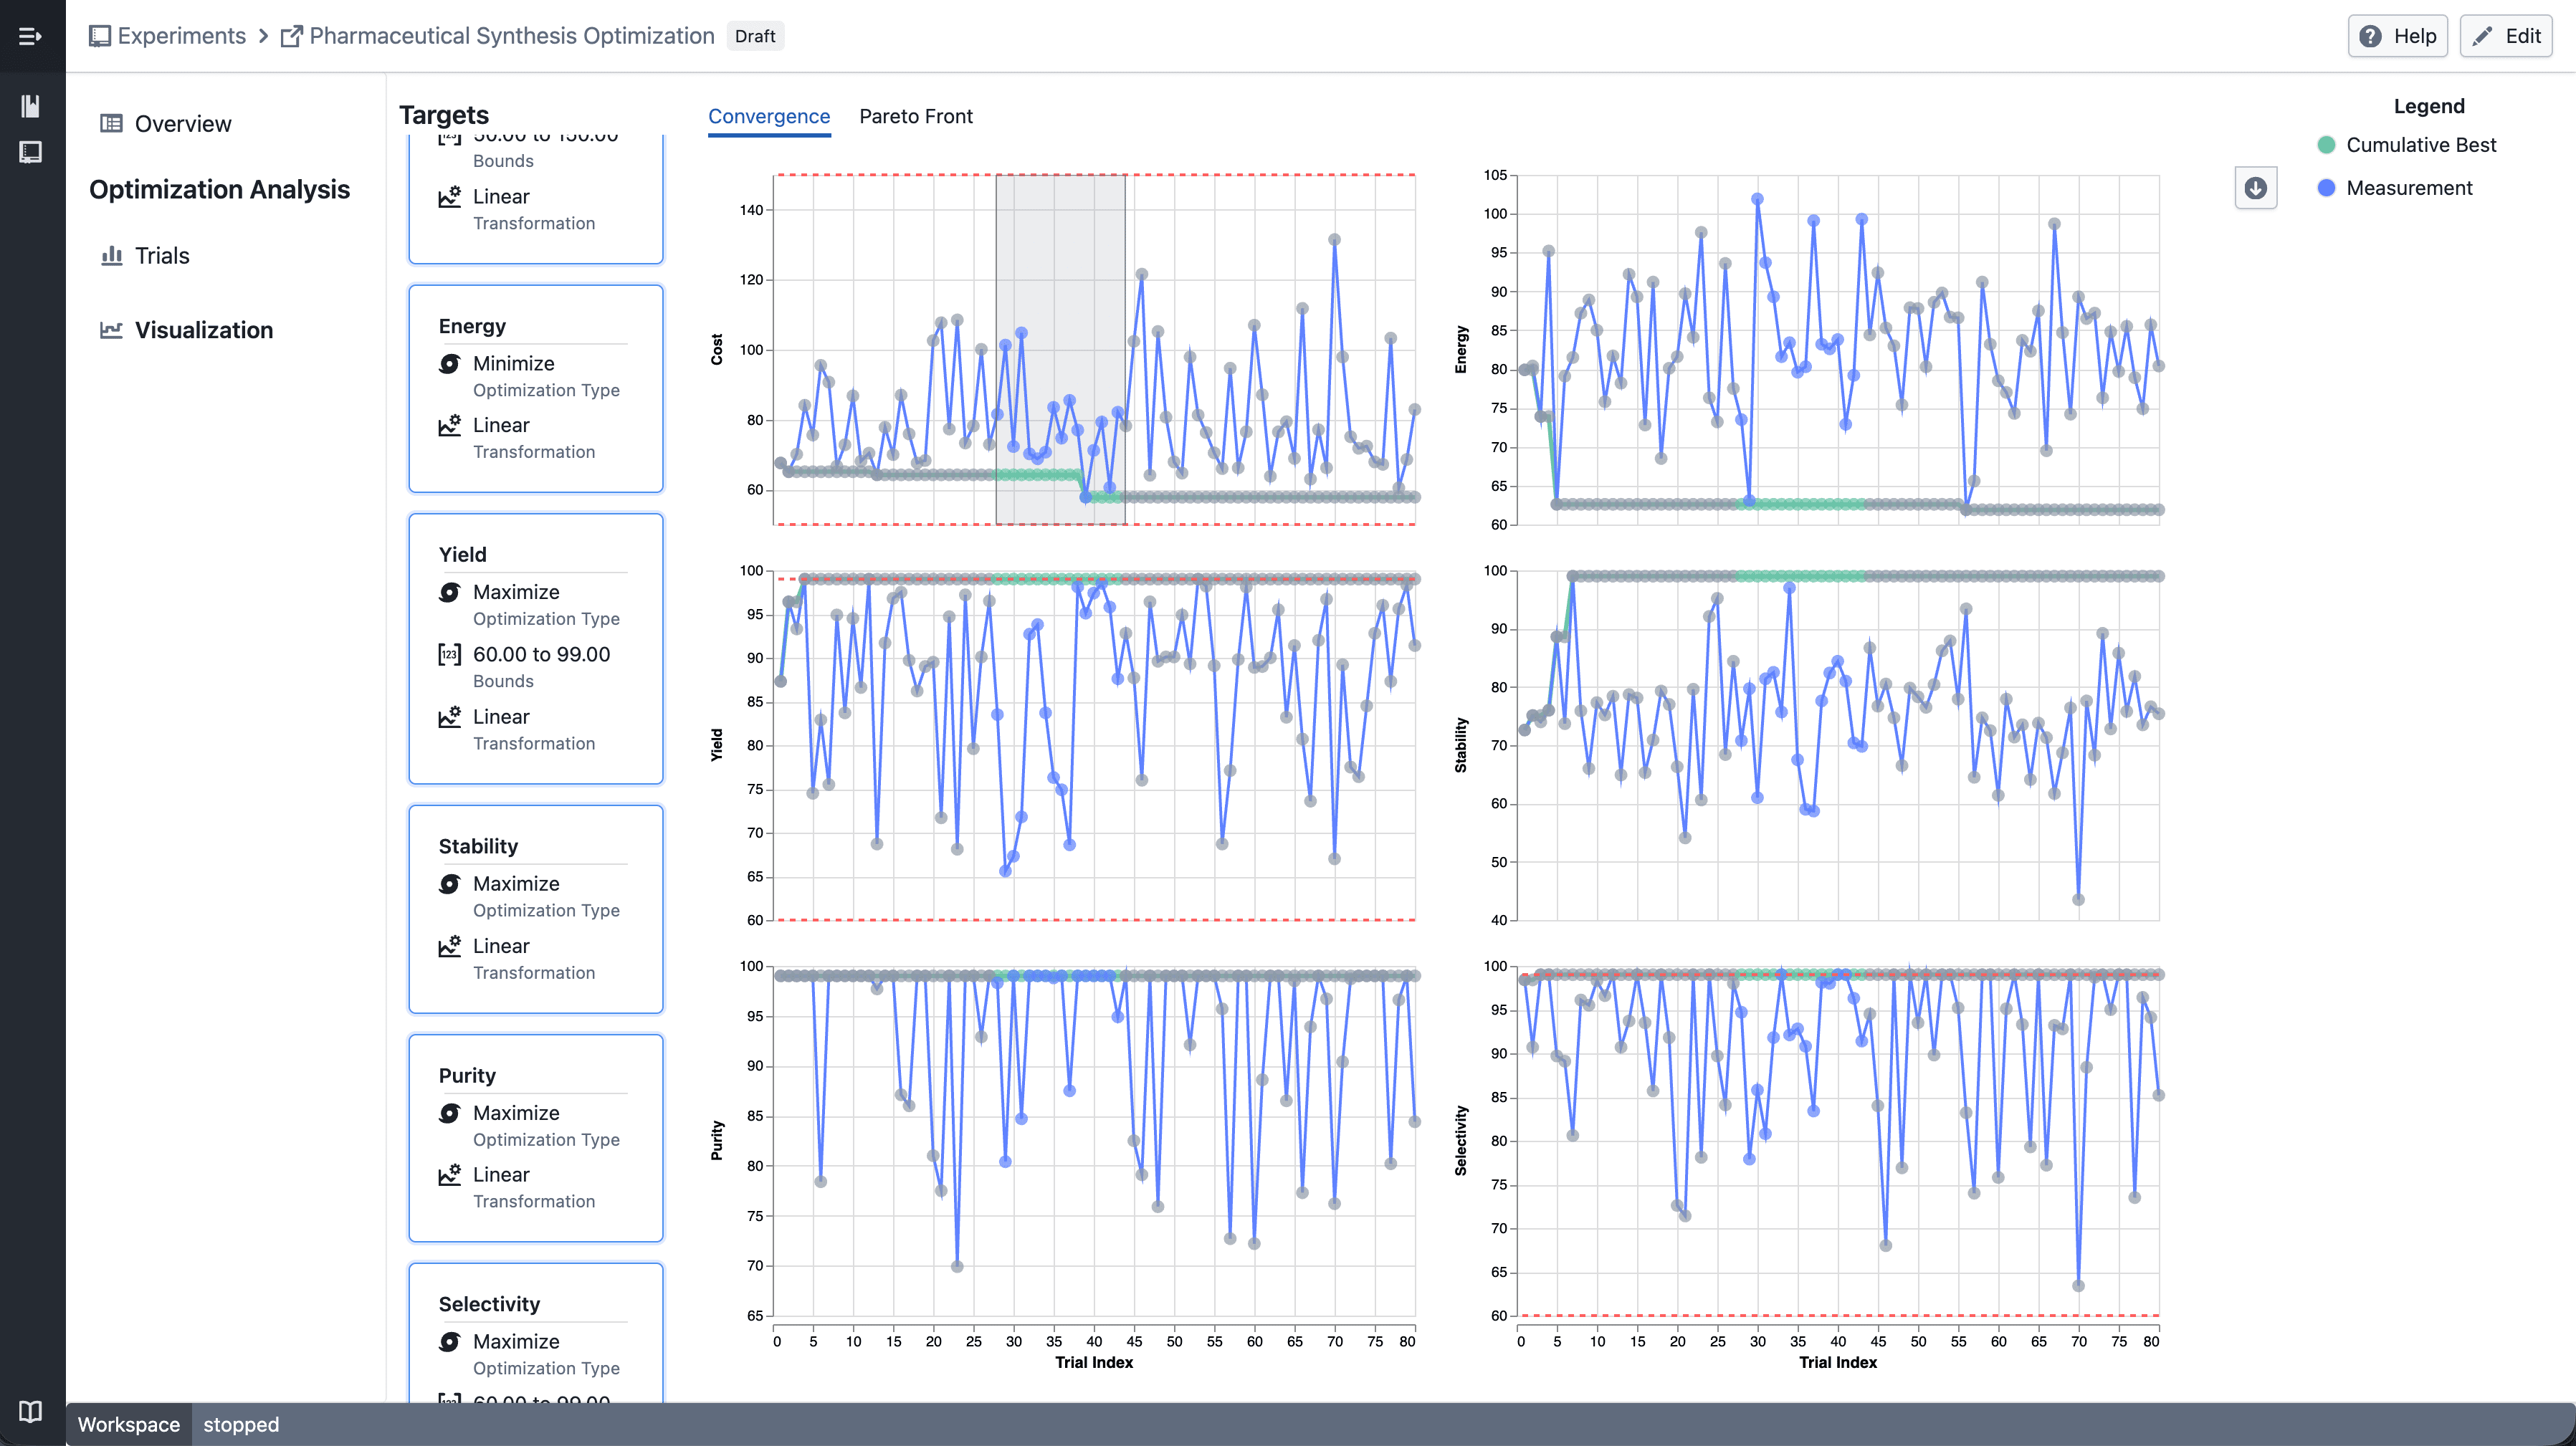
Trellis - draw point

  • Shift-drag to draw a brush selection across panels
  • Points outside the selection are dimmed
  • Up to 6 targets can be displayed at a time

Notes​

  • Single target selection continues to show the standard convergence plot
  • Trellis layout and interactions may continue to evolve during the beta phase
  • If you notice any unexpected behavior, please share steps to reproduce

Drop Column in Data Health

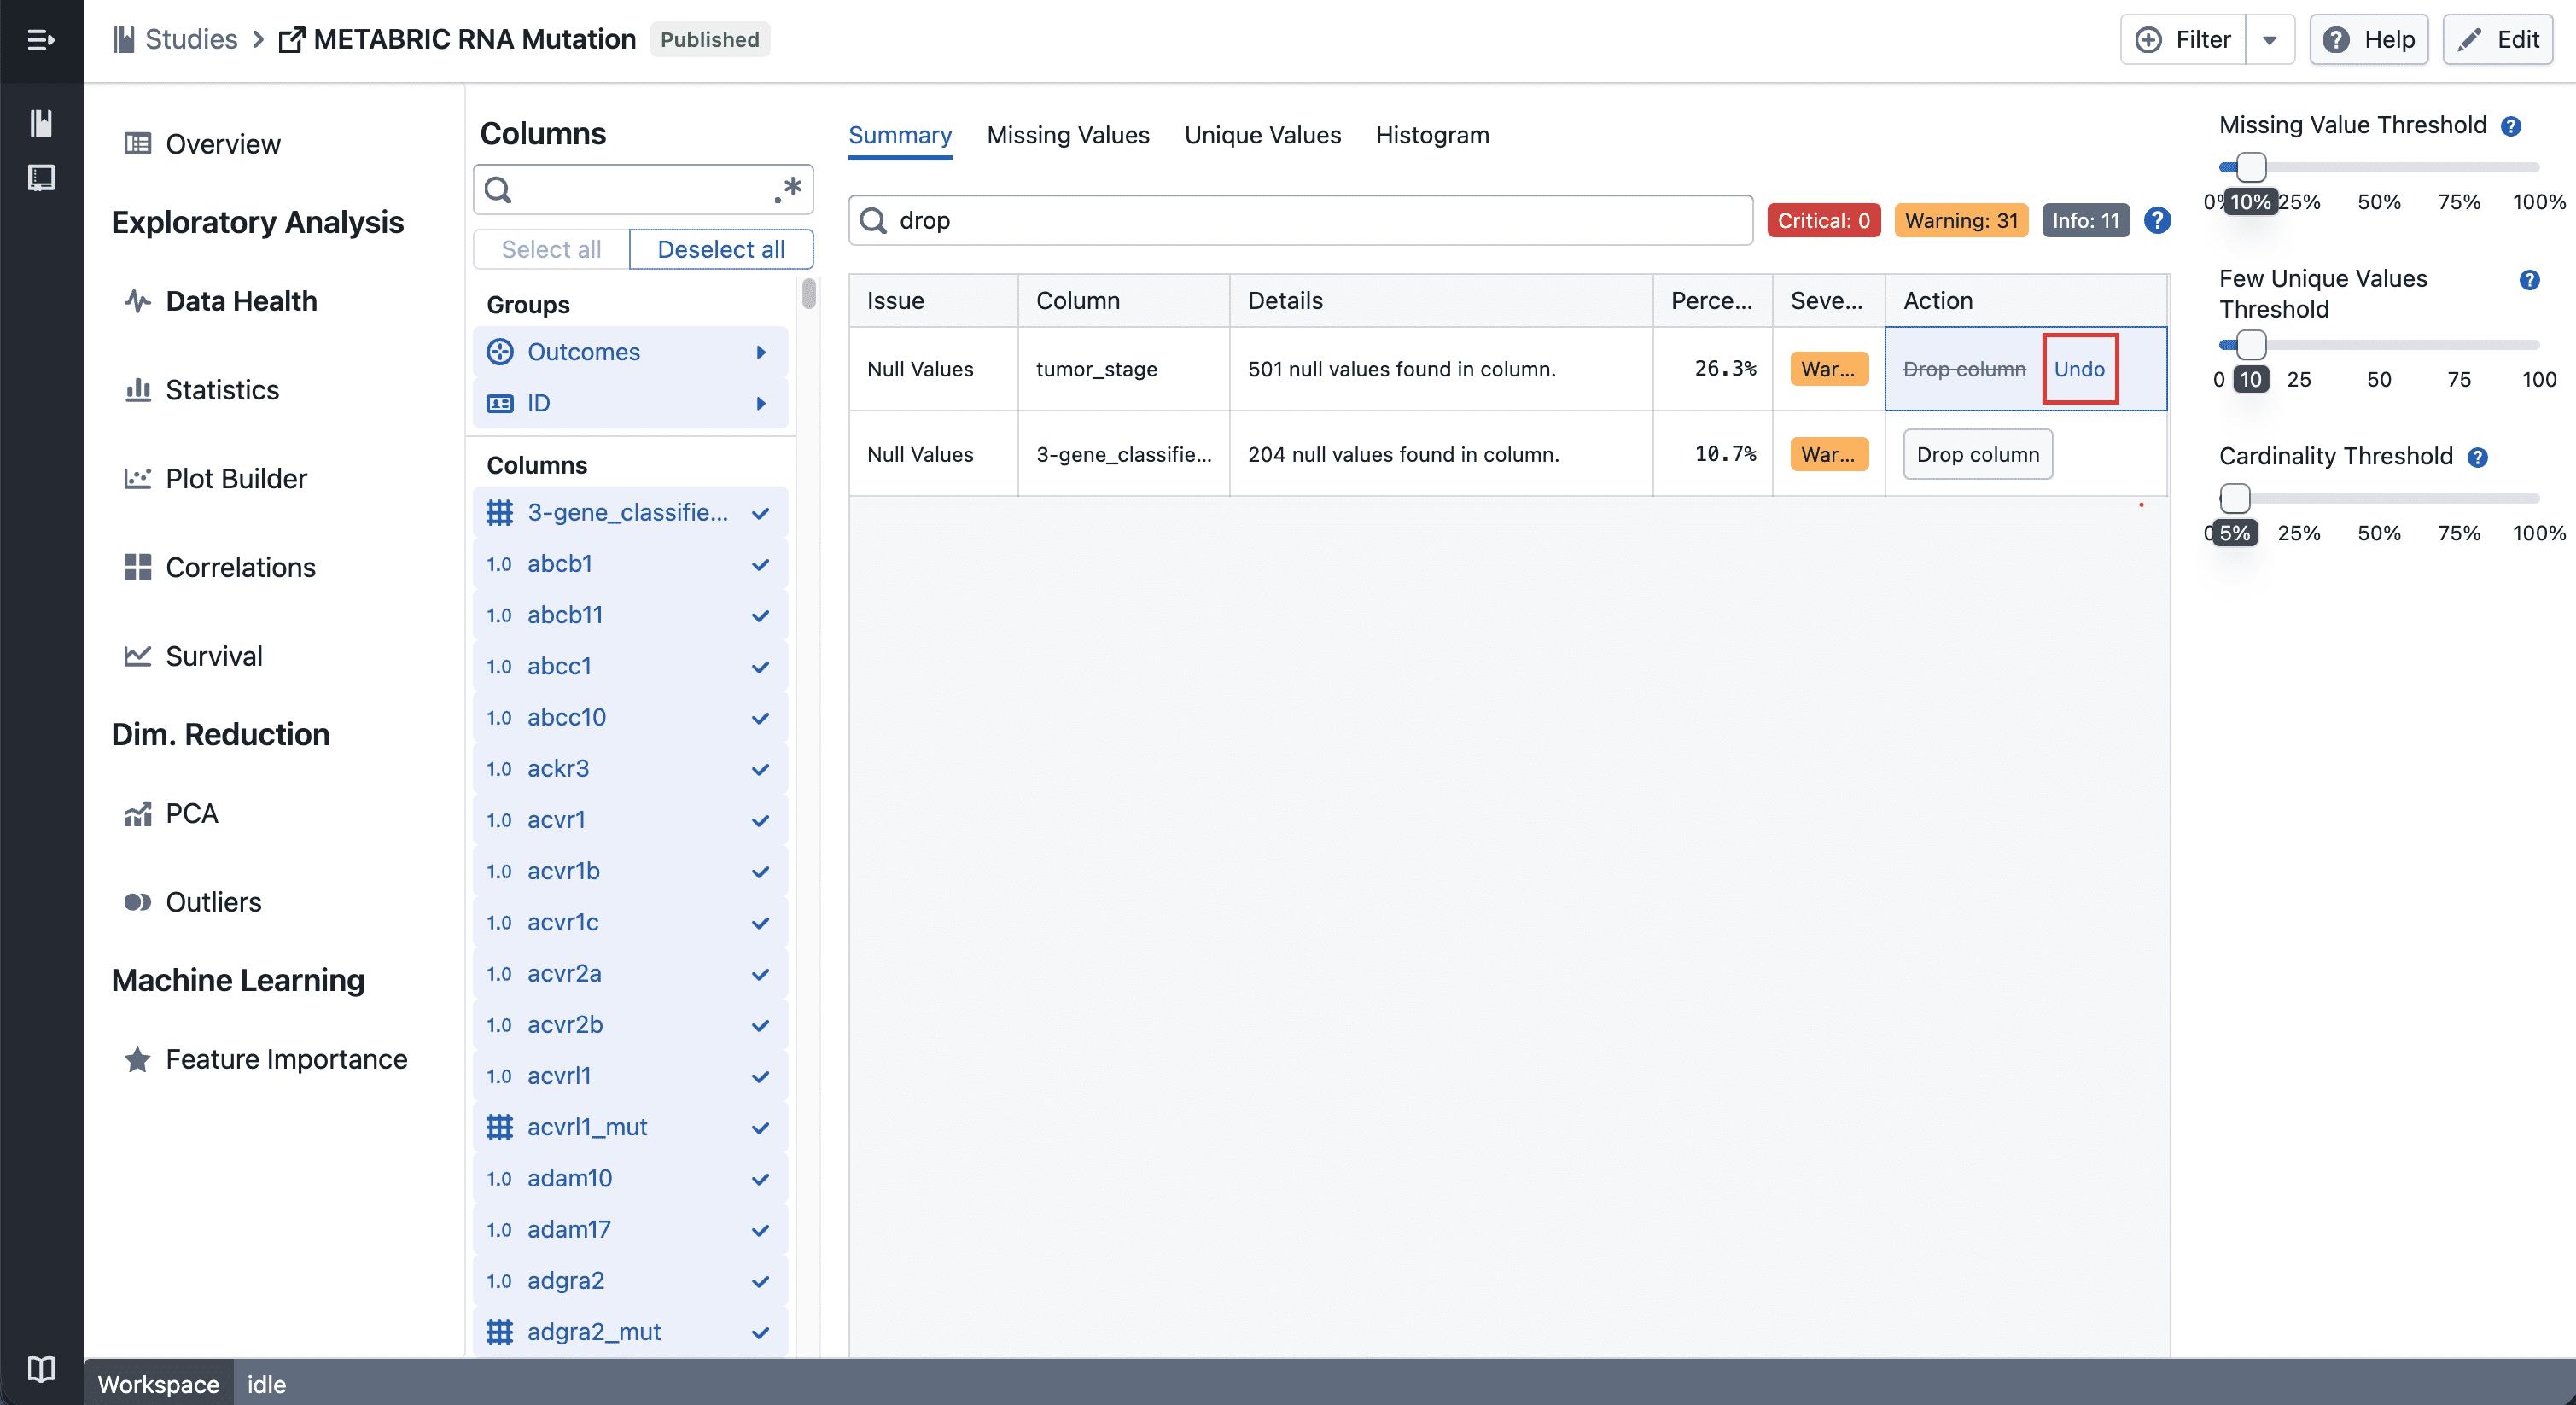
You can now drop columns directly from the Data Health table. Dropped columns are hidden across all study views and the change is saved automatically.

What's included​

Drop Column​

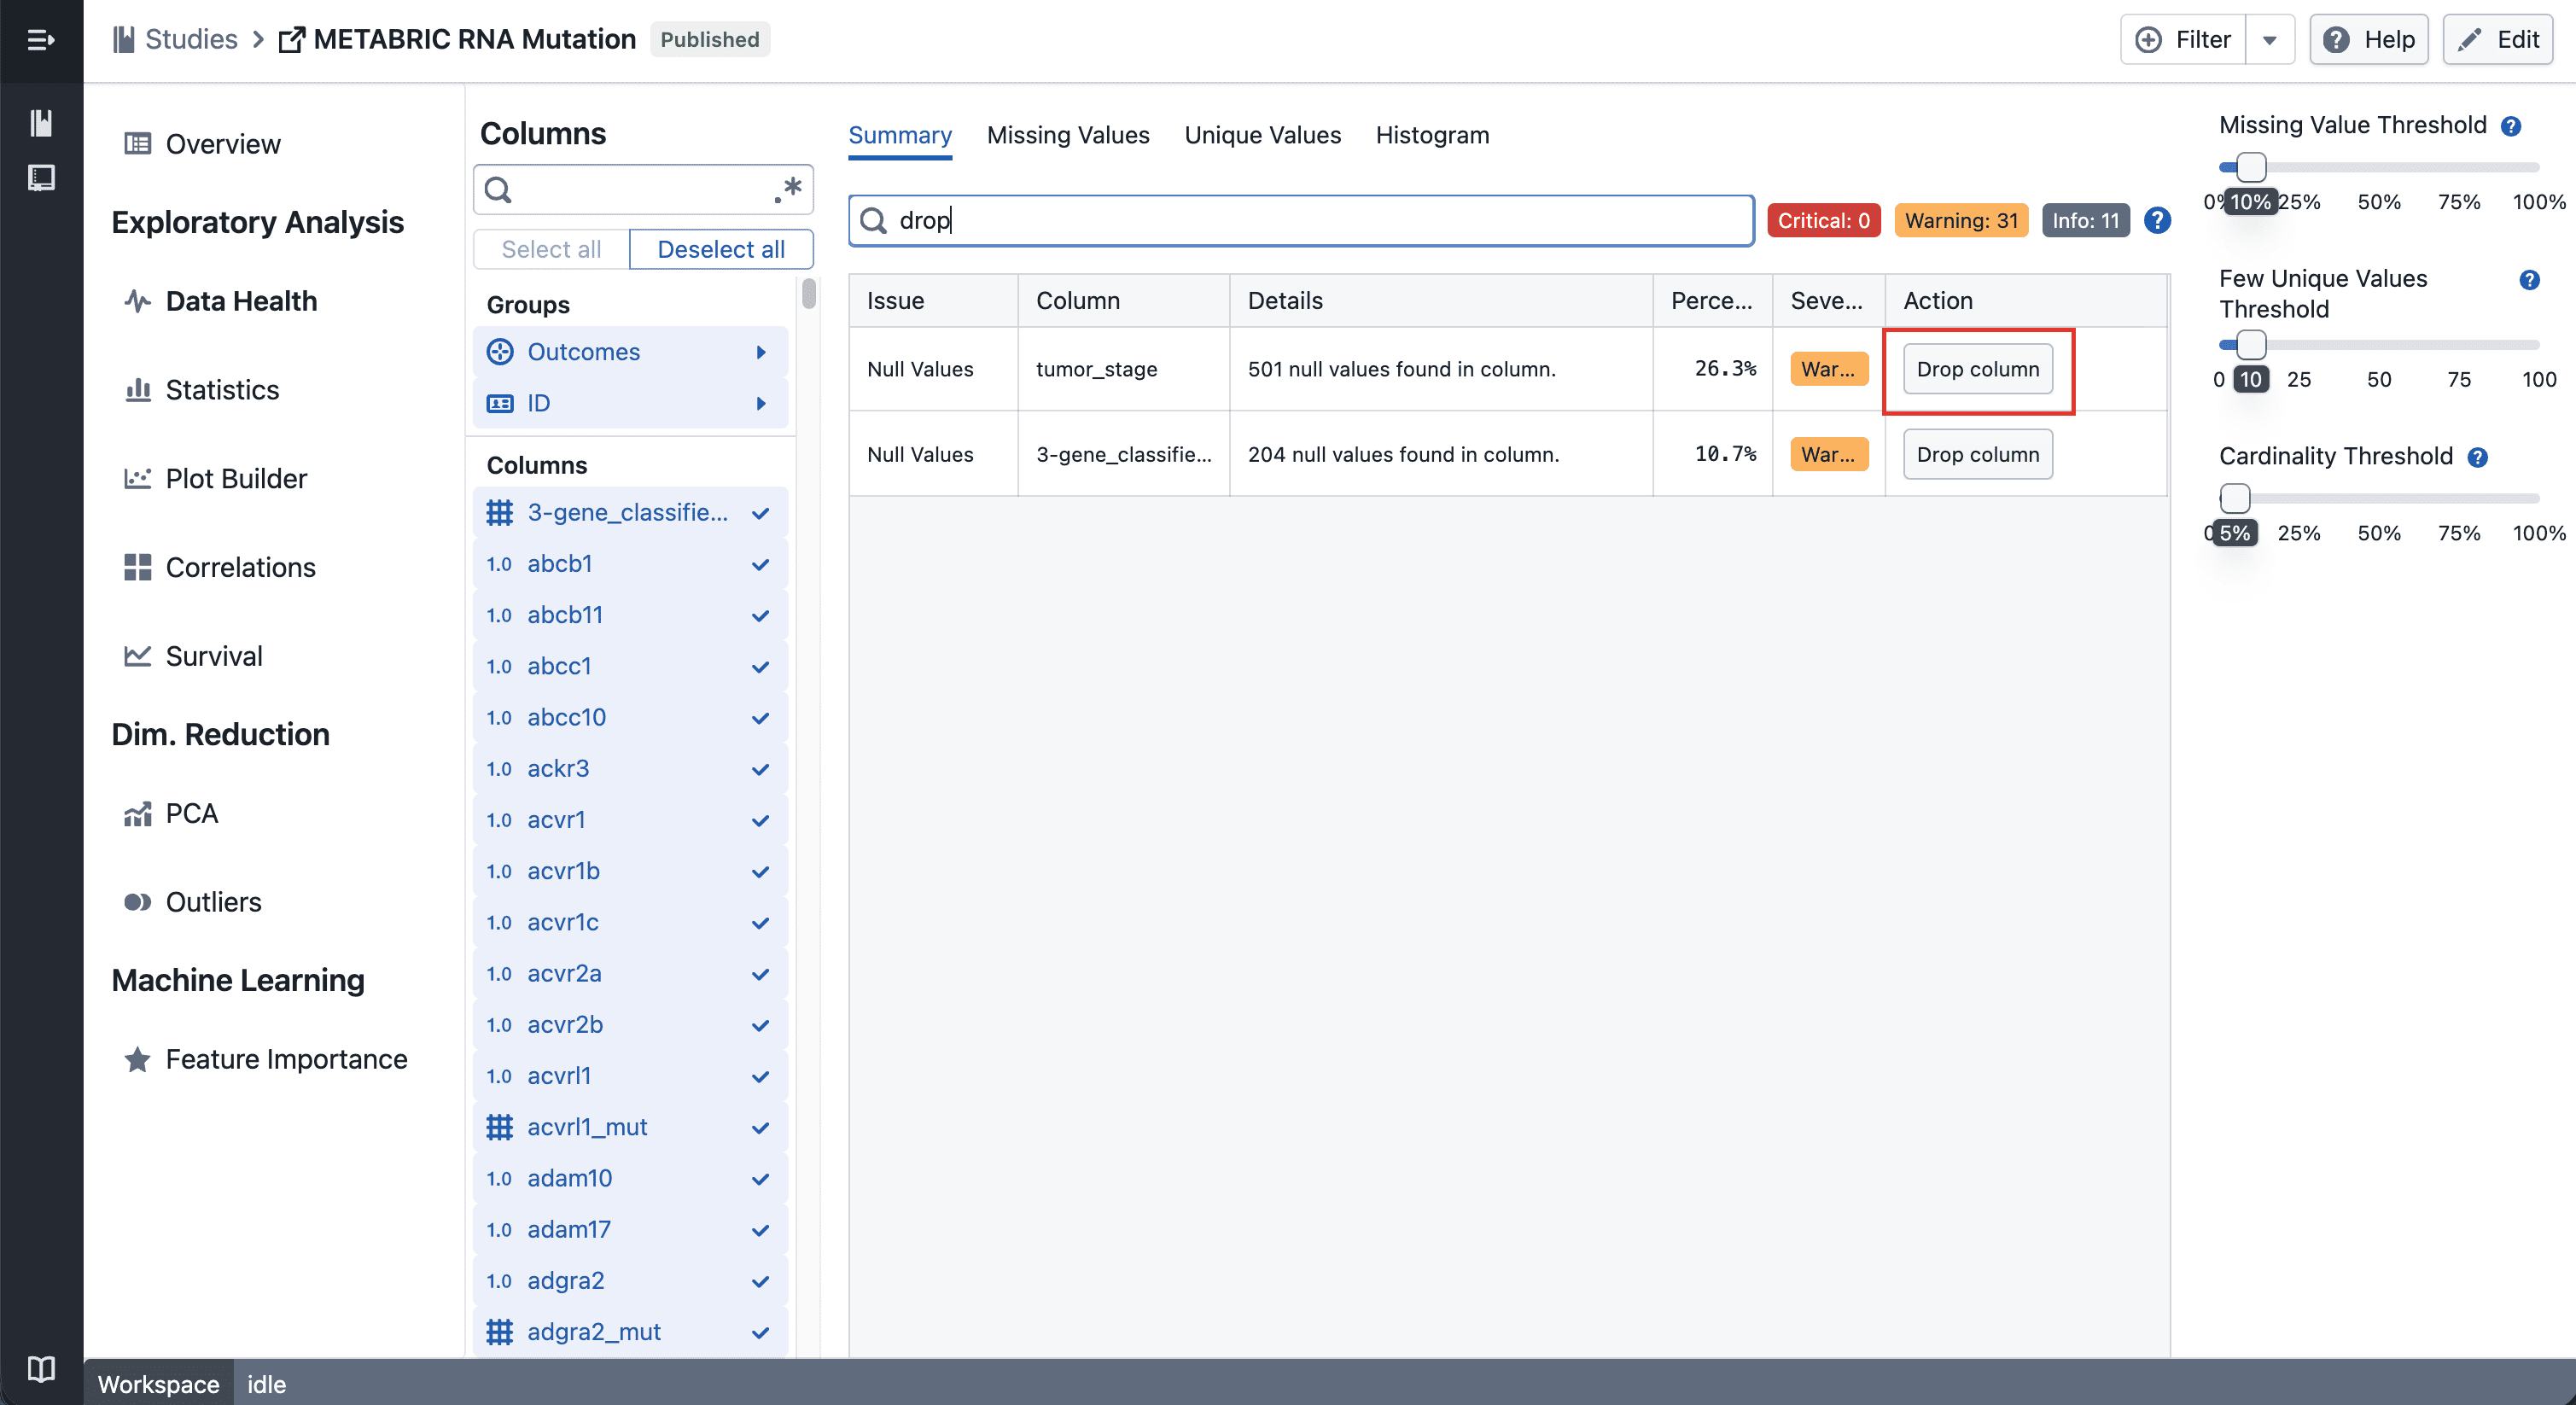
Drop Column Button

Click the drop button on any row in the Data Health table to hide that column across all views in the study — plots, statistics, and column groups included.

Undo​

Undo Drop Column Button

Changed your mind? Hit the undo button on the same row to bring the column back instantly.


Notes​

  • Dropped columns are hidden, not deleted — your data stays intact
  • If you notice any unexpected behavior, please share steps to reproduce

Multi-Evaluation Navigation in Feature Importance

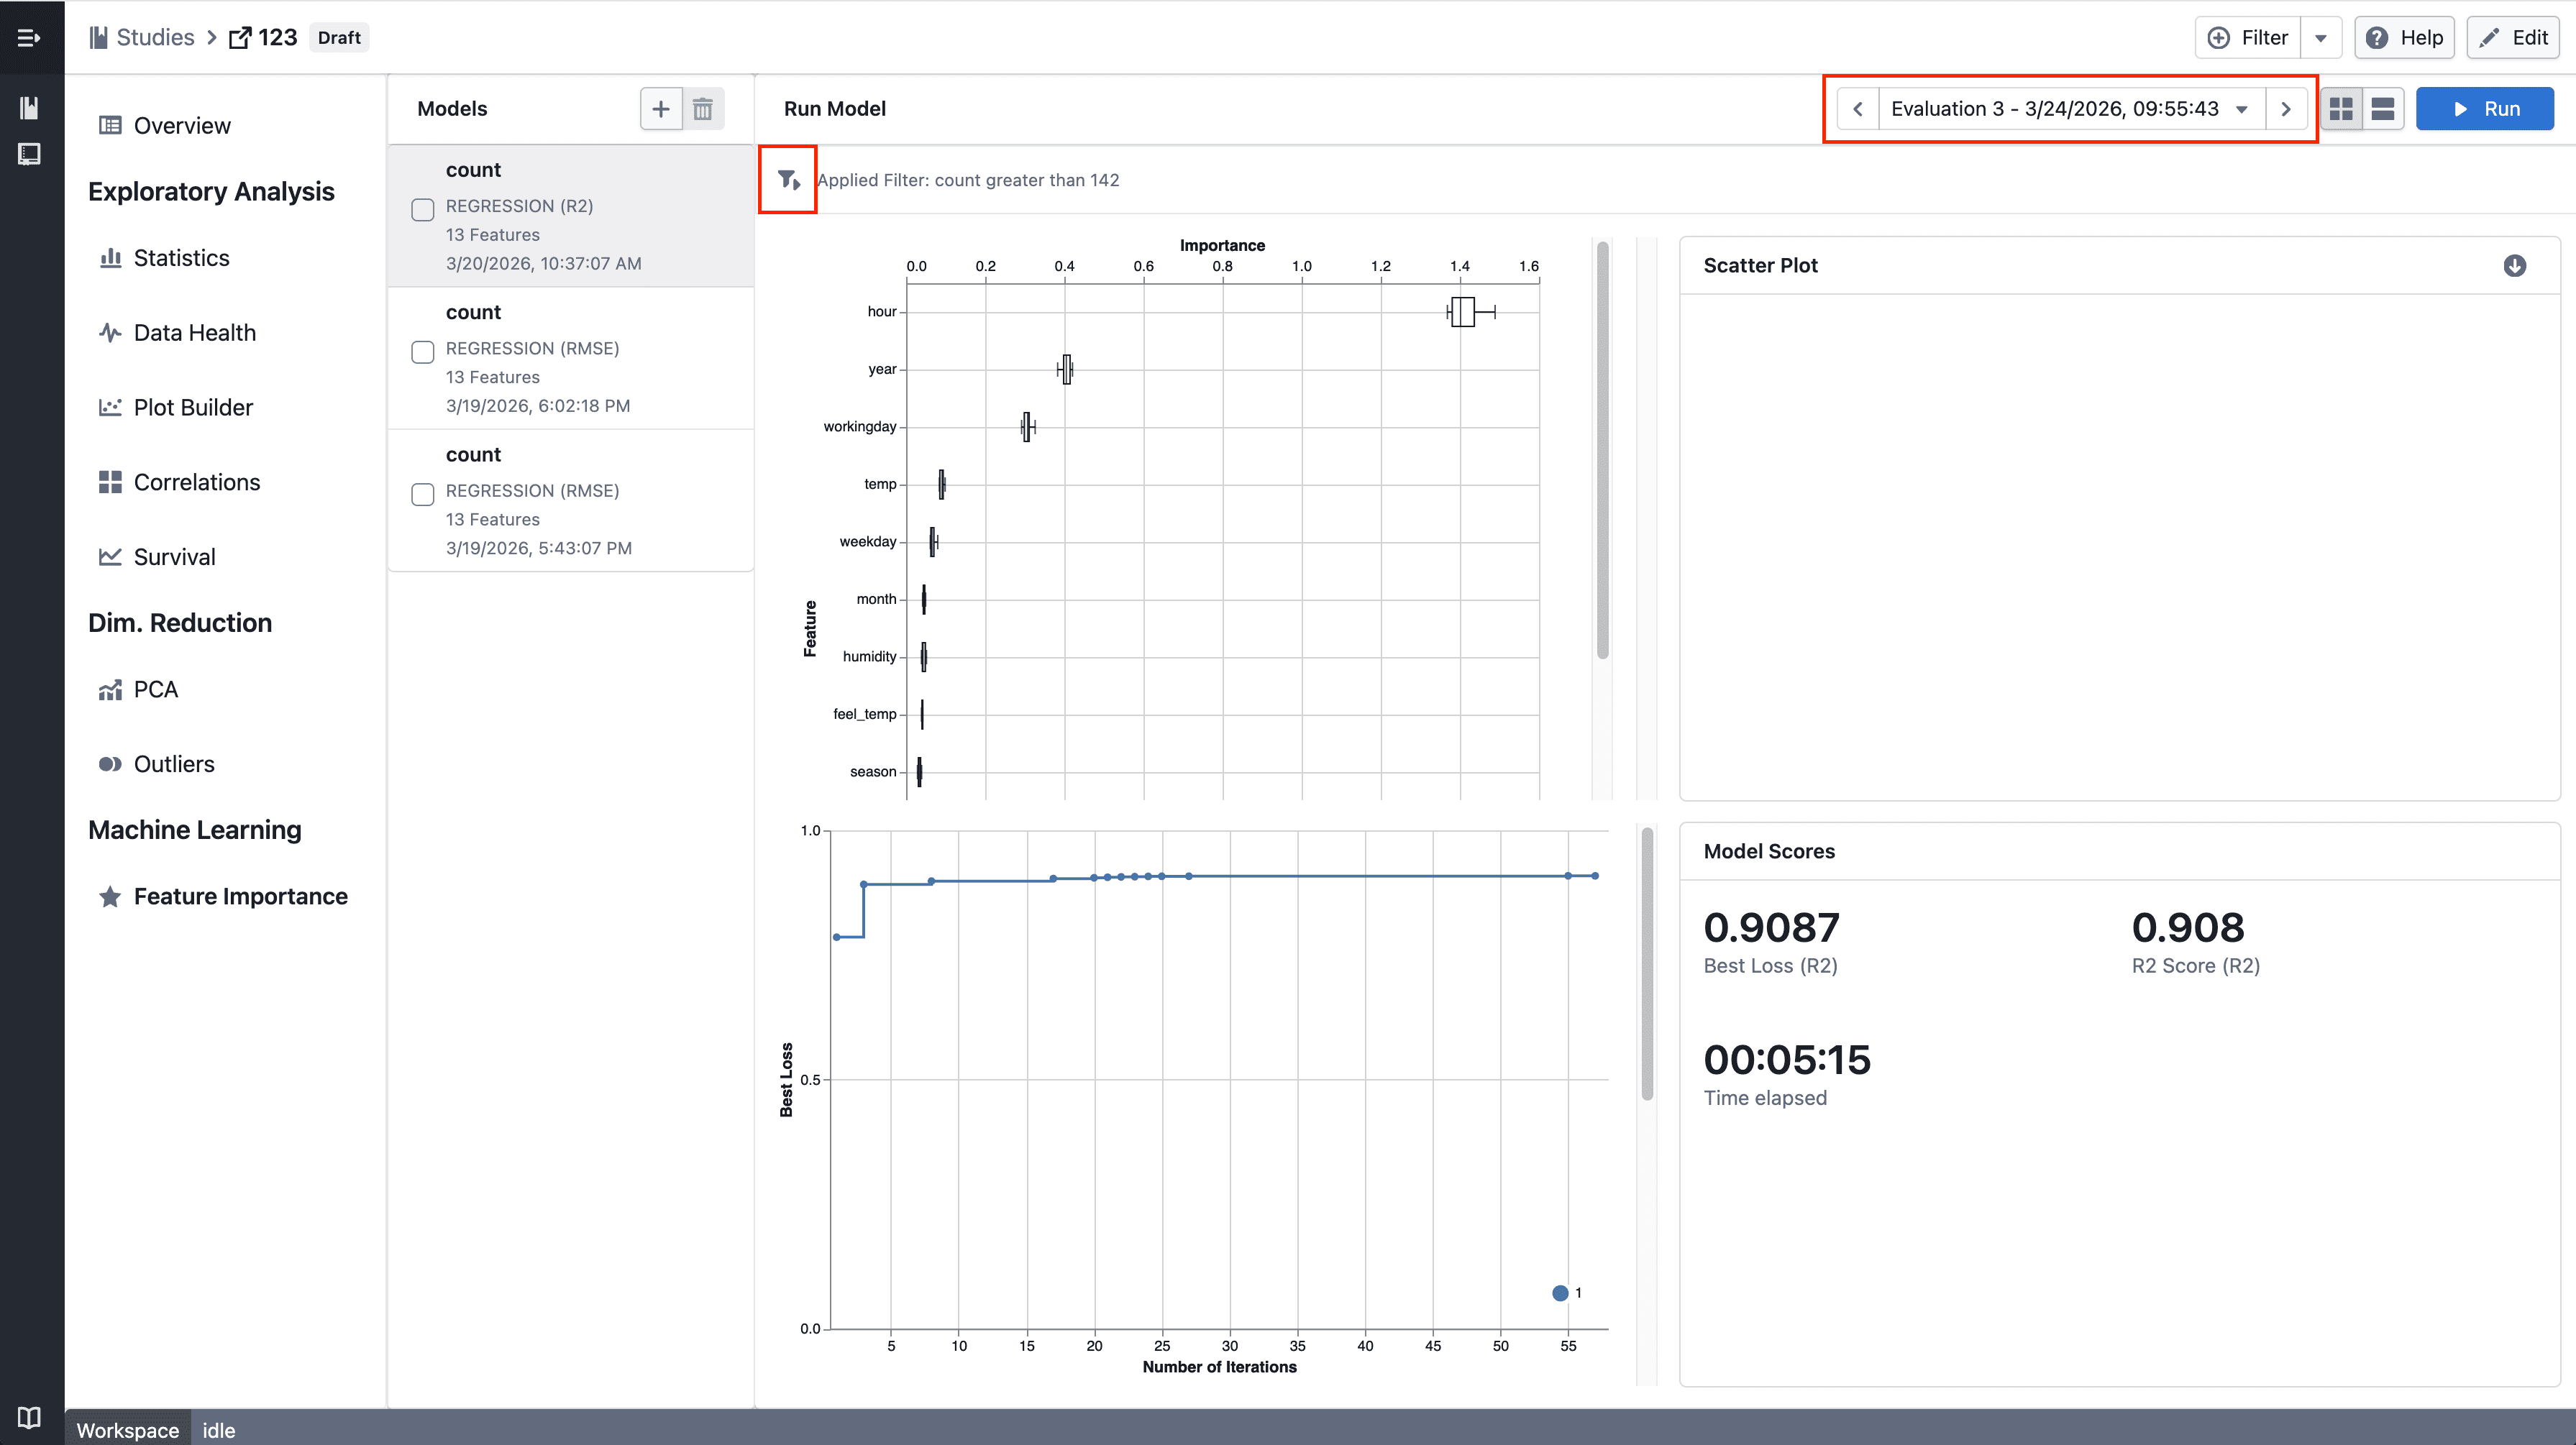
Navigate between historical model evaluations in Feature Importance.

What's included​

How it works​

Feature Importance

  • Step through historical model evaluations using the new navigation controls
  • The latest evaluation remains the default when no selection is made
  • Quickly reapply filters across views for consistent analysis

Notes​

  • If you notice any unexpected behavior, please share steps to reproduce

Trellis plots in Plot Builder

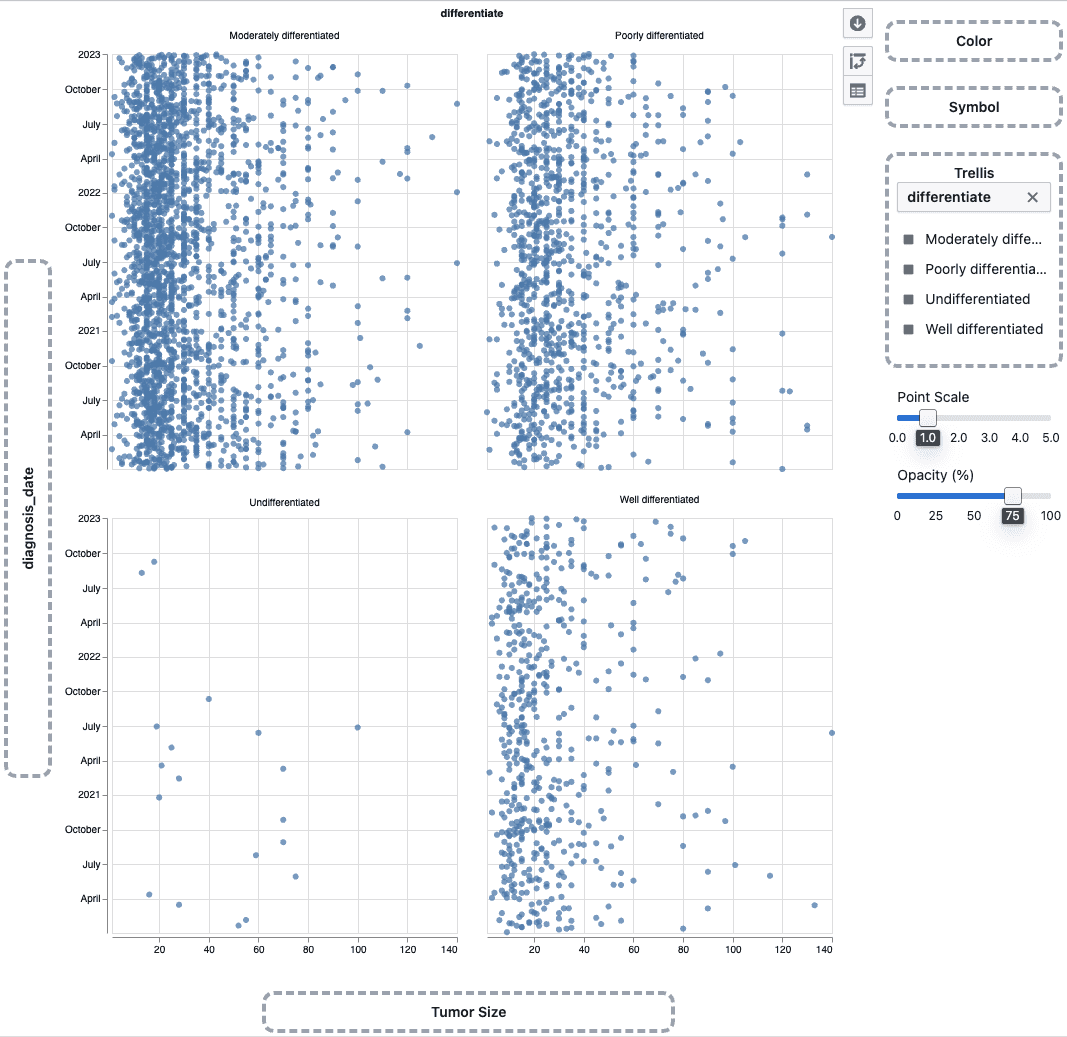
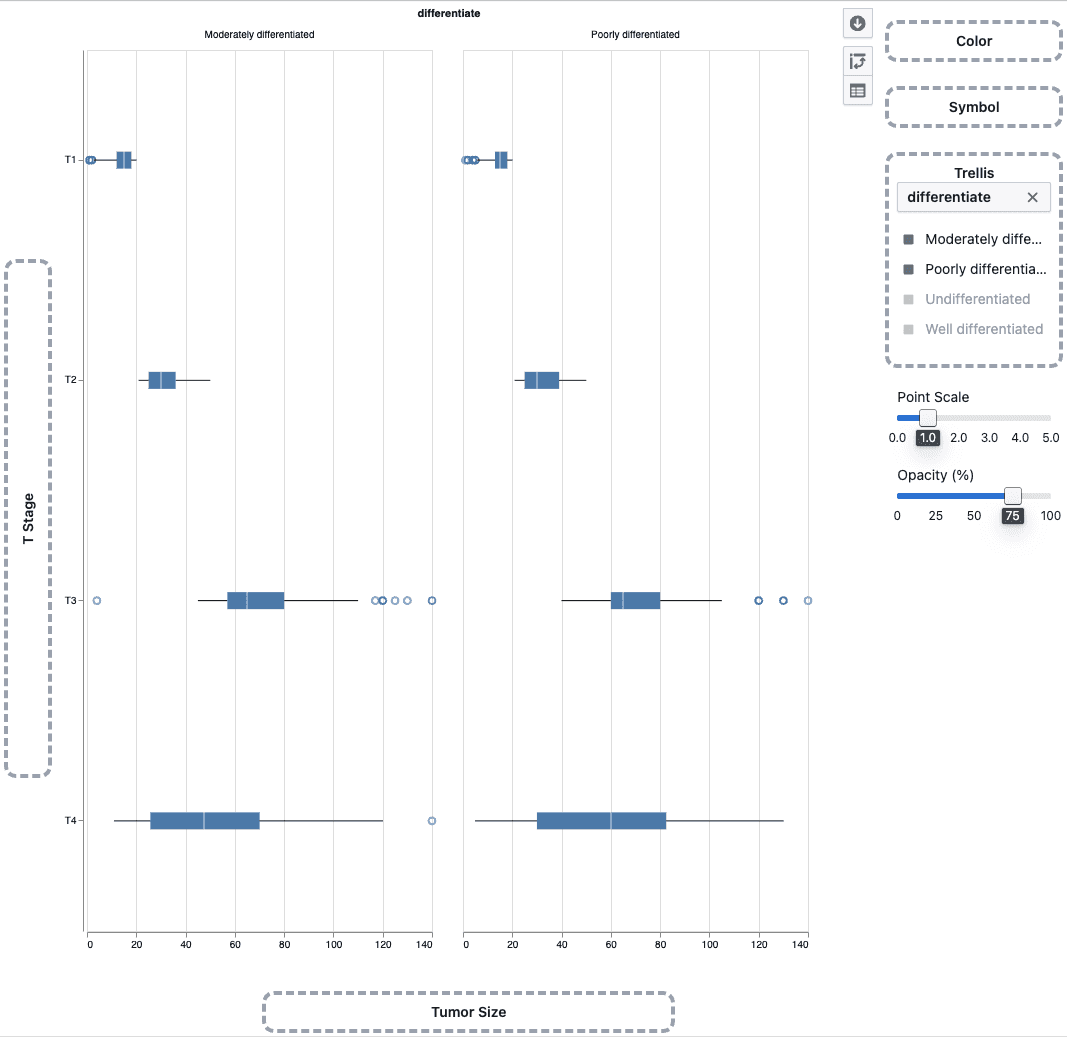
Split scatter plots and box plots into a multi-panel grid by any categorical column to compare patterns across groups side by side.

What's included​

How it works​

Trellis scatter plot

  • Drag a categorical column onto the Trellis drop zone in the plot sidebar
  • The plot splits into a grid of panels — one per category
  • Works with scatter plots and box plots

Trellis box plot

  • Use the trellis legend to choose which categories to display
  • Up to 4 panels can be shown at a time

Notes​

  • Heatmaps do not support trellis
  • Trellis behavior may continue to evolve during the beta phase
  • If you notice any unexpected behavior, please share steps to reproduce